
As part of our analytical process, we frequently consult our proprietary estimate of global money supply, something we construct by combining the individual measures for 15 countries (strictly 33, since we include the euro as one of them) which together account for almost three-quarters of global output.
When we do so, it immediately becomes apparent how much more closely trends in global equity markets – here approximated by the MSCI All-Country index – have tended to follow developments in the supply of this money since the onset of the financial crisis.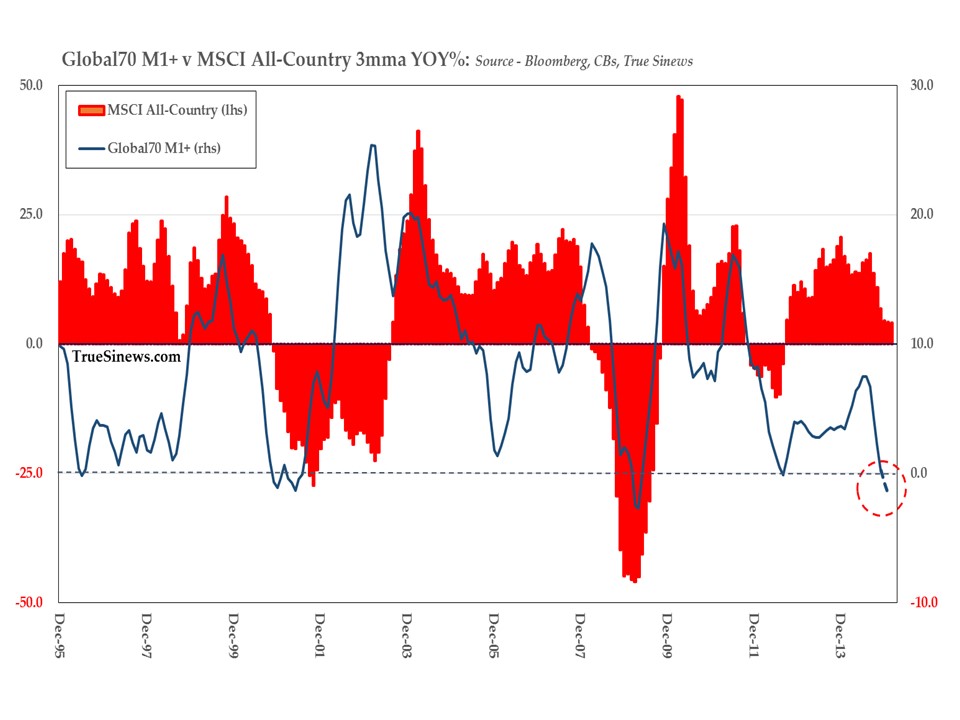
This strengthening of the relationship can be seen to hold even better for the advanced economies in our group:-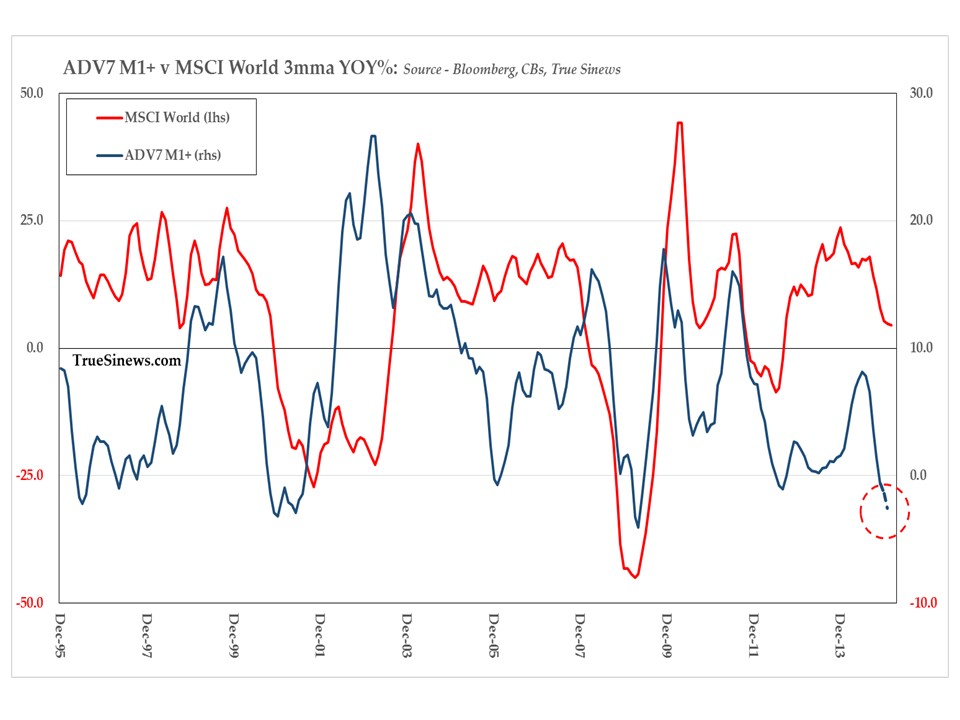
while when we instead consider the emerging market members as a subset, we discover that the relationship has held reasonably well over a much more prolonged period of time.
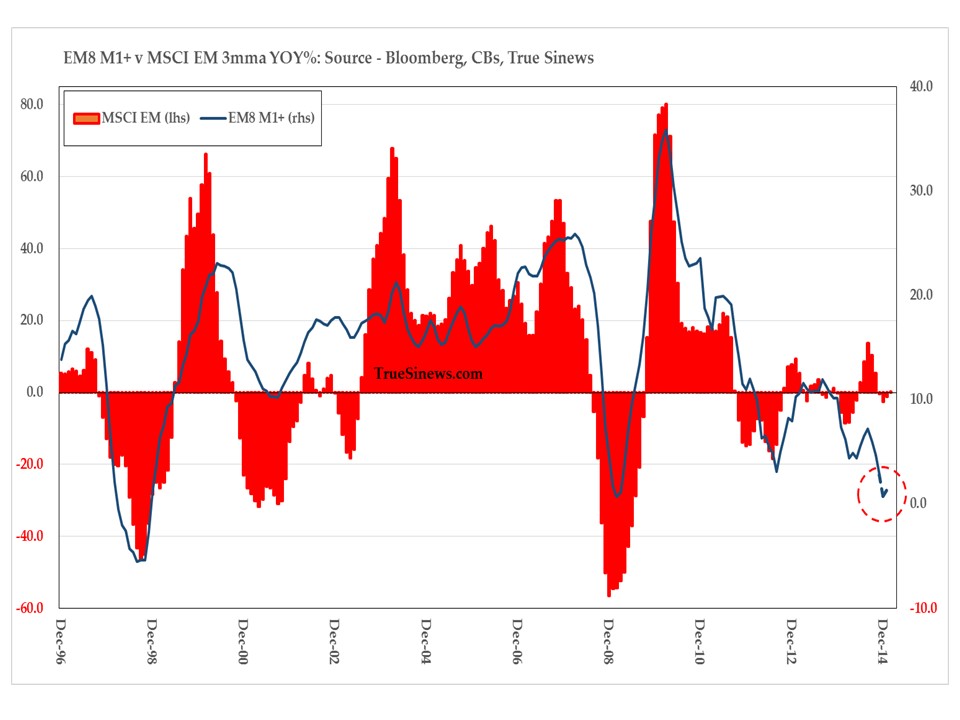
It should be apparent then that it is not just a truism to declare that, since the extraordinary easing cycle began in the wake of the Lehman collapse, the only game in town for stock investors has been the one being played so unremittingly by the central banks. Episodes of faster or slower money growth have increasingly come to correspond to rises or falls in the price of equities
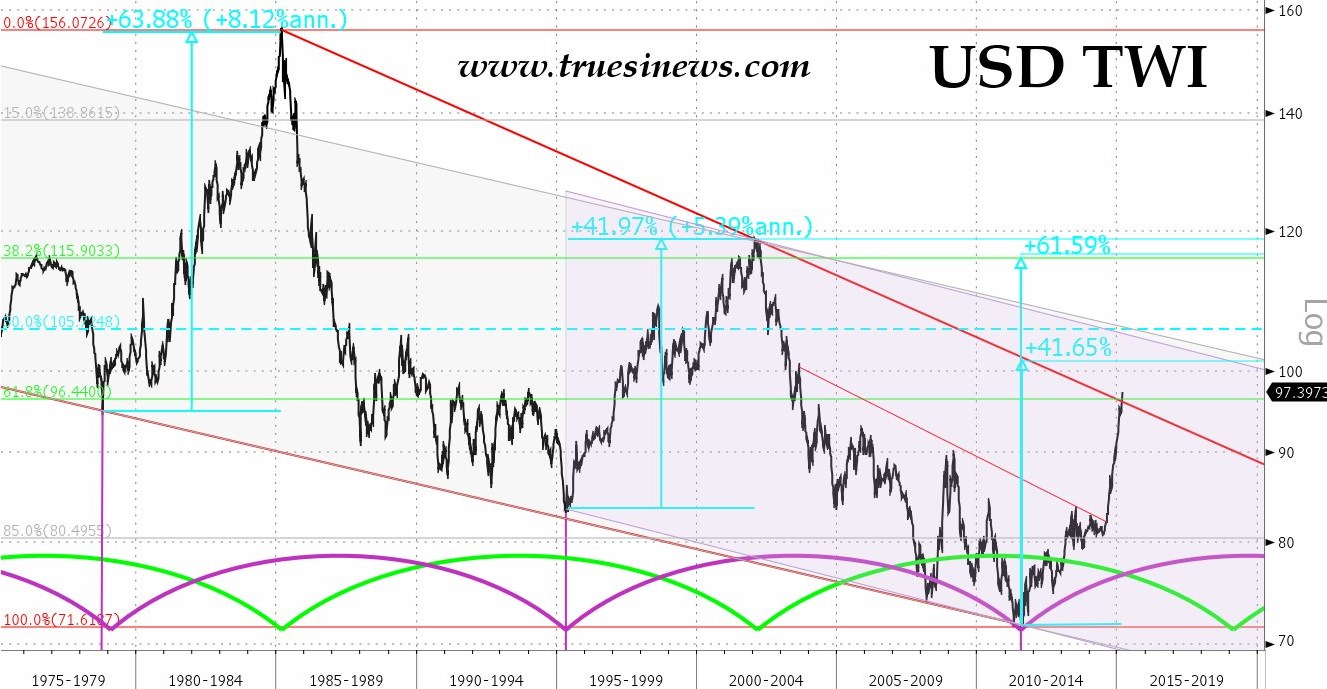
Given that our aggregation must involve the translation of component monies into a common currency – the US dollar being the obvious choice – it should further be evident that the two main sources of variation in this composite are firstly the changes in the supply of the individual countries’ money and secondly the ups and downs of the foreign exchange value of the dollar by means of which they must be translated. A strong dollar – other things being equal – therefore tends to diminish the effect on the international purchasing power of the whole and thus gives some theoretical underpinning to what is also a commonplace of the market, namely that a rising dollar is in some way expected to be contractionary.
Aside from these purely arithmetical considerations, several current account surplus countries tend to magnify the effects of US dollar developments by pegging their currencies to it more or less closely. To the extent they do this through a process of unsterilized intervention, a surfeit of dollar receipts therefore gives rise to an equal increment of domestic money since, at its most straightforward, the denizens of that country may take their USD earnings to the local central bank and have this latter institution issue new ‘outside’ money claims upon itself in the form of extra banking reserves.
Patently, these new claims can be freely spent at home – and, indeed, in good times, can be greatly leveraged up by the creation of the additional, spendable ‘inside’ money which the commercial banks can pyramid upon them. The inconvenient fact, however, is that no new goods or services have been made available to those now endowed with an expanded count of funds. We can surely see in this disco-ordination where trouble might soon arise. Indeed, we are twice cursed here since the exports which first gave rise to all this new money constituted nothing other than the act of putting a sizeable quantum of goods explicitly beyond the reach of local buyers. This is therefore a case where the often vexed concept of the reserve issuer ‘exporting inflation’ actually bears up under scrutiny
As for those living beyond their productive capacities in the US, the fact that their IOUs are accepted globally, without quibble, and that the acceptors have no choice but to place them back in the market and so ‘recharge’ the pool of loanable funds gives rise to the infamous ‘deficit without tears’ and hence to the not wholly inaccurate observation that the issuer of the principal reserve currency enjoys an ‘exorbitant privilege’ on that account. We say not wholly inaccurate because this treatment ignores the workings of the offshore or eurocurrency market by which a Spanish petrochemical company, say, can pay its Qatari supplier of natgas in dollars, too, having simply asked that its own bankers in Bilbao create them ab novo in much the same manner as its American competitor might demand of its bankers in Boston.
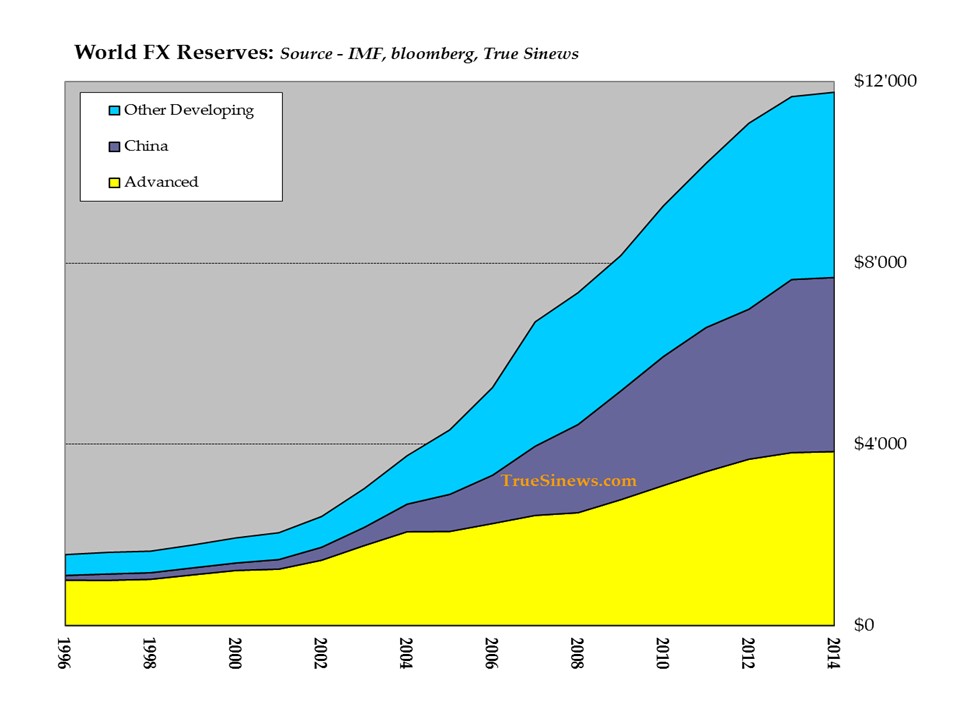
As can be seen from the foregoing chart, over the past decade of what was mostly a rapid expansion of an often dangerously unbalanced trade, the world has effectively split into three blocks of ‘privilege’ granters, with the developed nations, China, and all other developing nations respectively now being responsible for just short of $4 trillion each – i.e., for roughly equal shares in a total which amounts to around nine months’ worth of global merchandise trade.
We note in passing that this partly understates the advanced nation’s quota since this latter has been suppressed by the introduction of the European single currency. This device has enabled its participants to hide the disparities between them which still amount to the $700 billion or so left of a peak $1.3 trillion creditor position in the Target 2 balances which have come to substitute for forex reserves within the Eurozone.
Though we should not fixate too simplistically on the cross-border movement of goods and services when independent flows of capital can amount to solid multiples of these, several factors have nonetheless conspired in more recent years to slow the growth of the reserves associated with the former. For one, America’s growing oil output has helped reduce its current account gap by more than half in the past eight years, reducing the supply of dollars emanating therefrom by over $400 billion a year. In turn, finance-starved Spain, Portugal, Italy, and Greece have had little choice but to reduce their external deficits from the Boom’s peak by a sum which comes to around $350 billion combined.
In recent months, too, the plunge in energy prices has exacerbated the general diminution of commodity country exports – slicing crude and product flows alone by over $1 trillion a year – while China has seen its capital account halve and its financial outflows soar to the point that a cumulative $280 billion goods trade surplus in the final semester was not enough to prevent the country from experiencing a $150 billion net reserve drain. As a whole, the IIF projects emerging market surpluses to dwindle to less than a third of their 2008 peak this year – for an overall decrement of around $370 billion.
With the dollar having strengthened by more than 20% nominal since the second half of 2012 began – at a rate which has now equalled the fastest recorded like-period 30 weeks of the Volcker-Reagan ‘SuperDollar’ era, set in 1981 – stresses are palpably beginning to mount.
Courtesy:Bloomberg
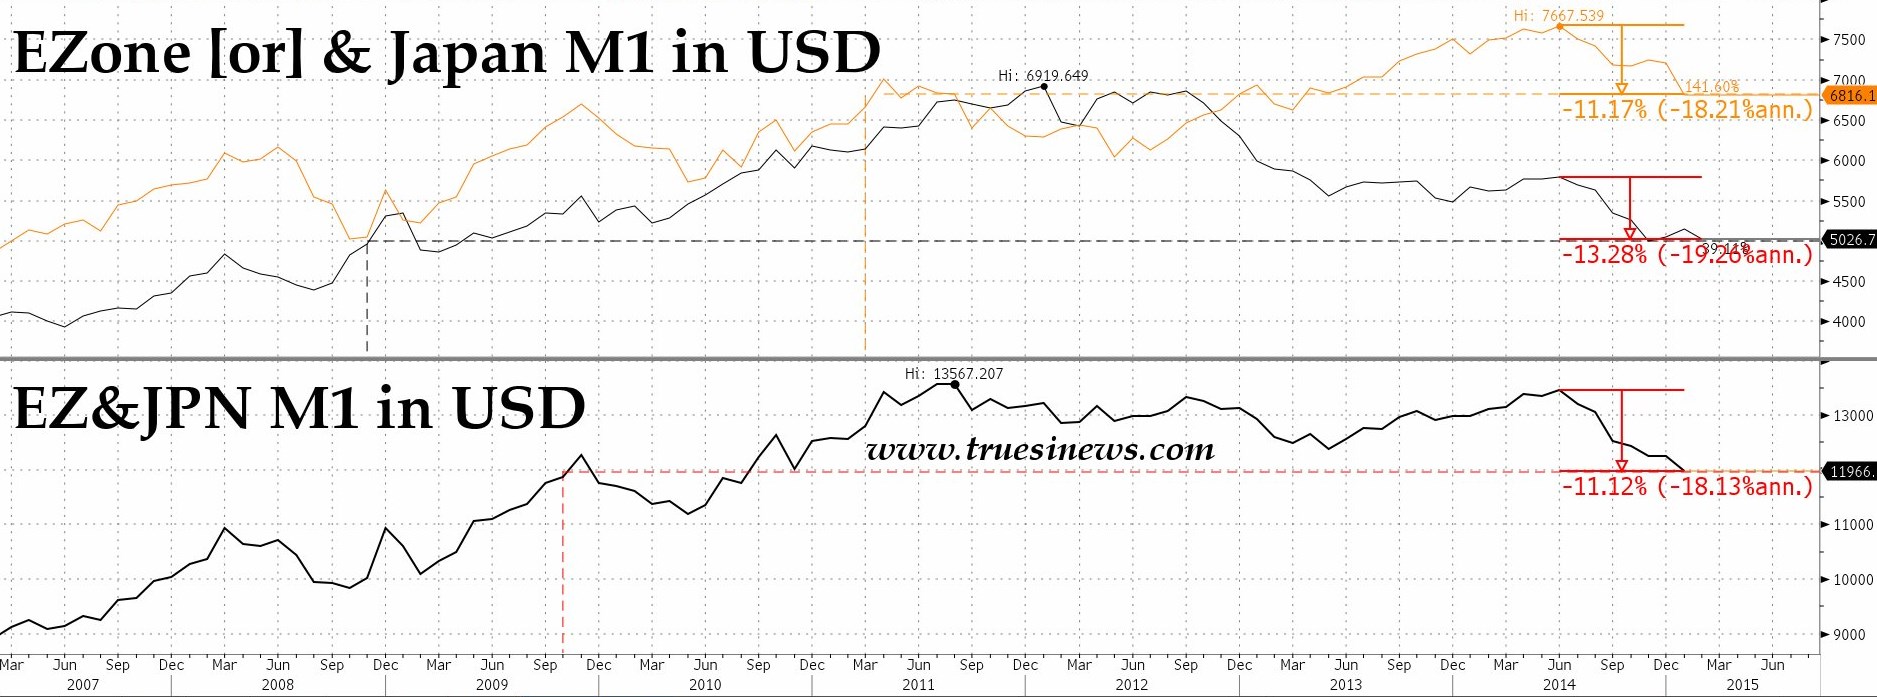
In the first instance, the Greenback’s rise is pushing down global money growth simply by translation, as explained above. Perhaps, the best example of this is to be had by noting that, to the end of January, both Japan and the Eurozone have seen double-digit USD-denominated declines in M1 since the summer, to set the sum of the two back to the levels of late 2009, Draghi and Kuroda notwithstanding. Given that the yen has dropped 3% and the euro more than 5% since then, we can safely assume that worse is to come.
Courtesy: Bloomberg
As yet hard to quantify but undoubtedly a very real concern, financial stresses will also be mounting among all those who have spent the last several years borrowing cheap and often depreciating dollars in order to fund assets which are often no longer throwing off anything like the cash flows they once were expected to generate. In the context, it will be cold comfort to recall that the SuperDollar did not take long to cause substantial casualties among the LDCs (as they were then known) who had been the grateful recipients of ‘recycled’ petrodollar surfeit as means of plugging home-grown financing shortfalls.
Courtesy: Bloomberg
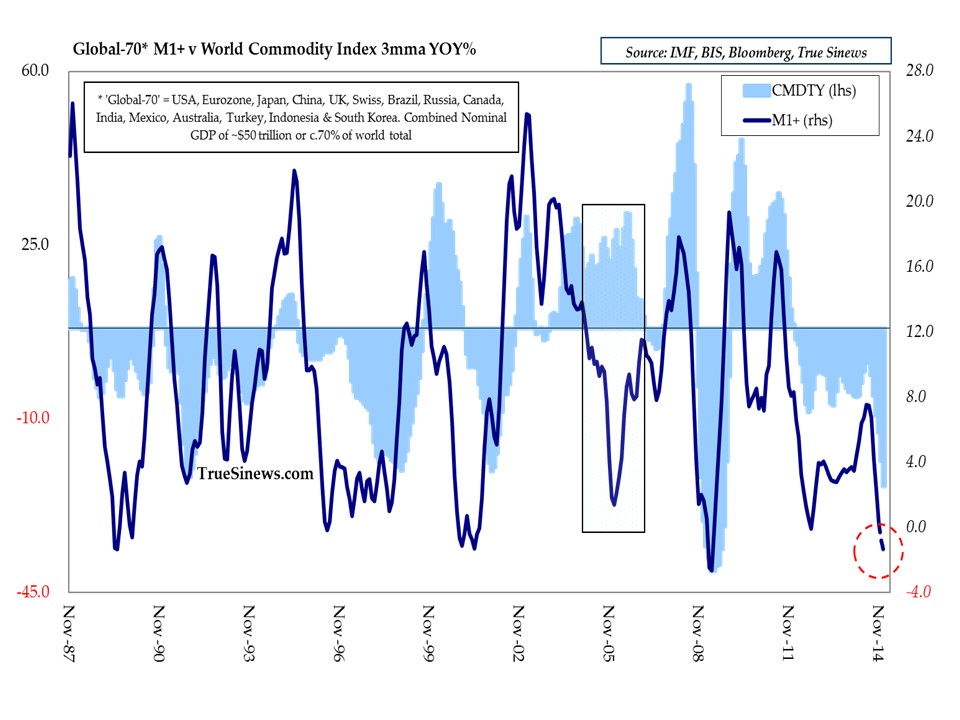
Under the circumstances, it is problematic to disentangle cause and effect between endogenous money growth, currency effects, and resource country exchange management practices, but what is undeniable is that, with only a brief interlude in the mid ’00s, swings in money growth from strong to weak and back again have been matched by similar oscillations in commodity prices. Given what we suspect is happening to the money numbers, therefore, further commodity price weakness would hardly come as a surprise.
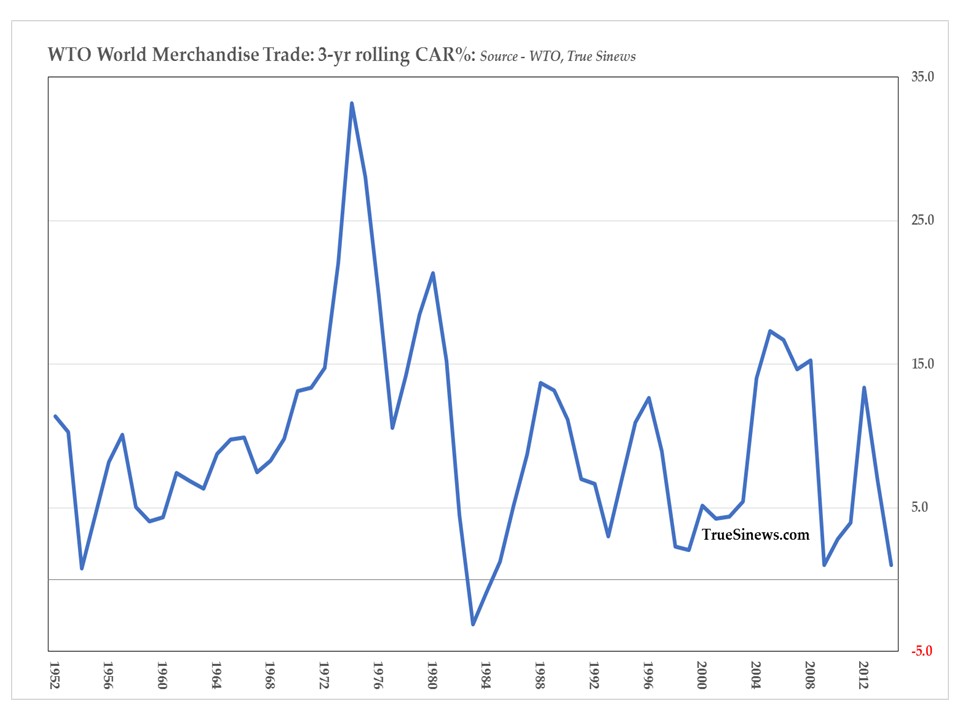
The upshot of all this is that, on the broadest of horizons, global trade growth has slowed to a crawl with the pace these last three years the slowest in three decades and the second most tardy in six.
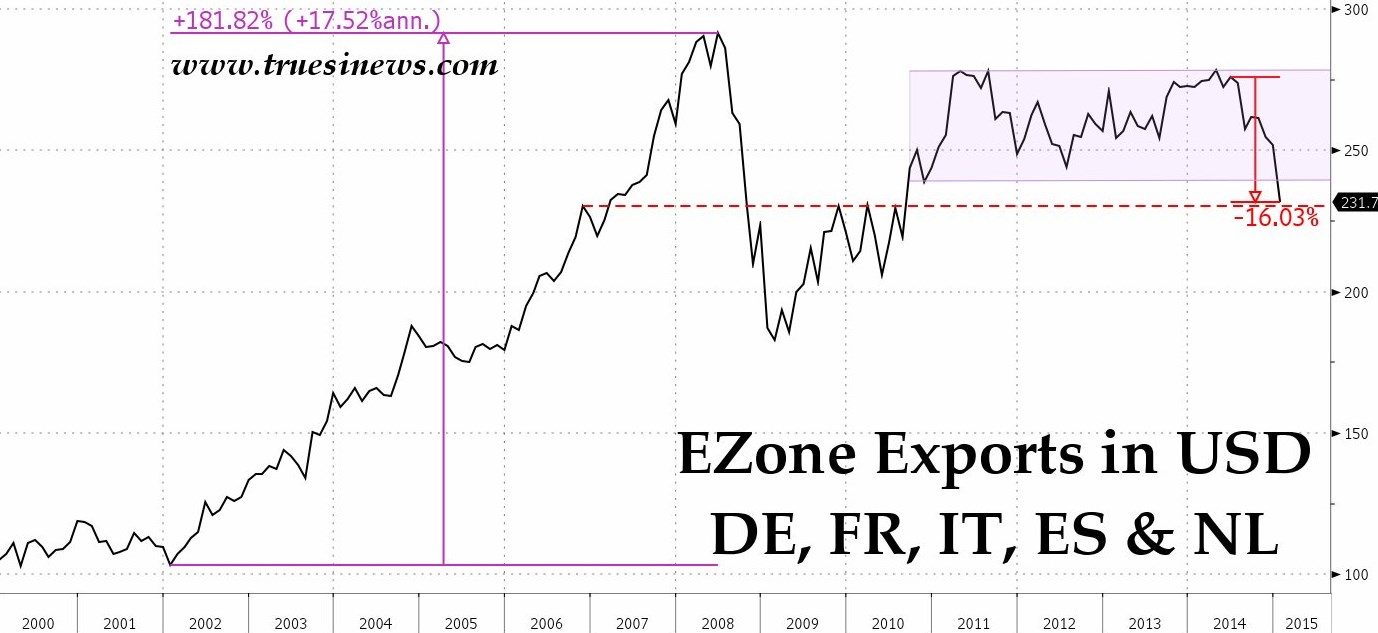
Within these numbers, for all the talk of a quickening of the European economy, exports of the most important six economies in the Zone have only managed to look respectable under the camouflage of a falling numeraire: strip away that disguise by tallying them up in USD and we can see that the last couple of quarters have been an absolute horror show.
Courtesy: Bloomberg
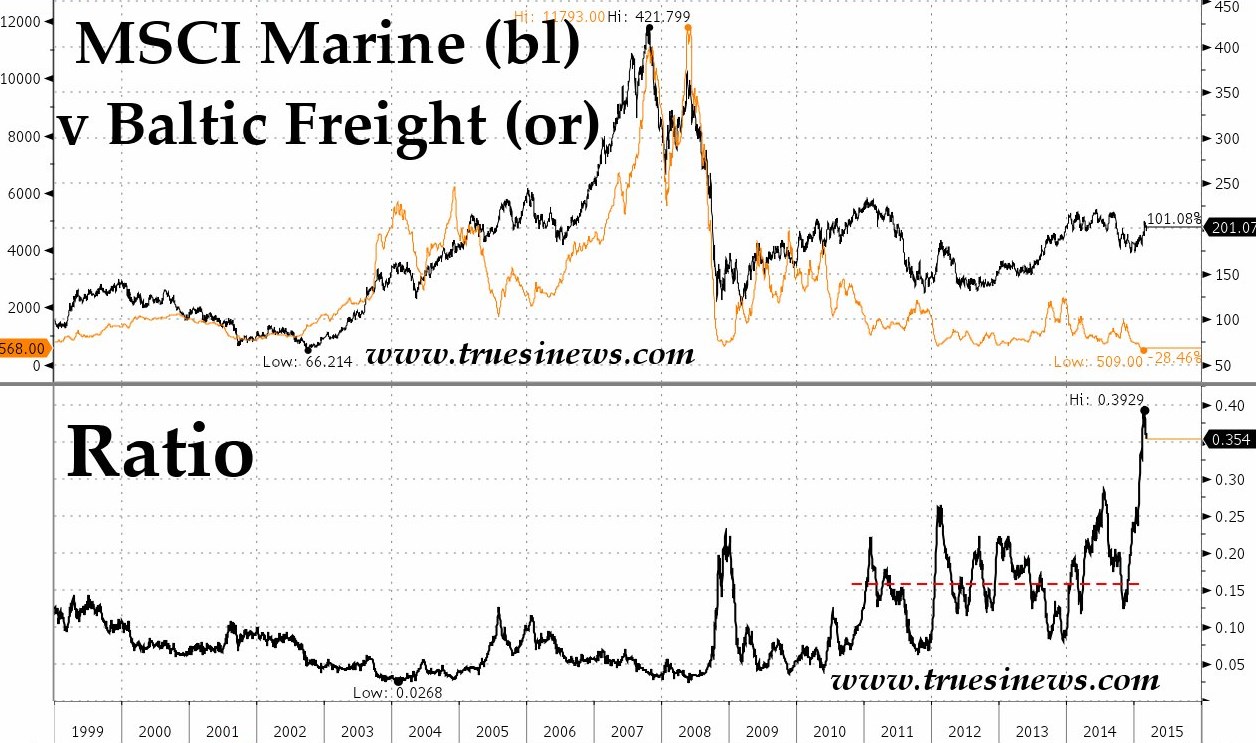
If you were looking for an explanation for why the Baltic Dry index has been so sickly of late, you need look no further. What is intriguing though is the relative value of stocks in the MSCI Marine index – companies which may well have the partial offset of dramatically lower bunker fuel prices to compensate for fewer cargoes but which are still off the scale in terms of the recent history of their relative standing.
Courtesy: Bloomberg
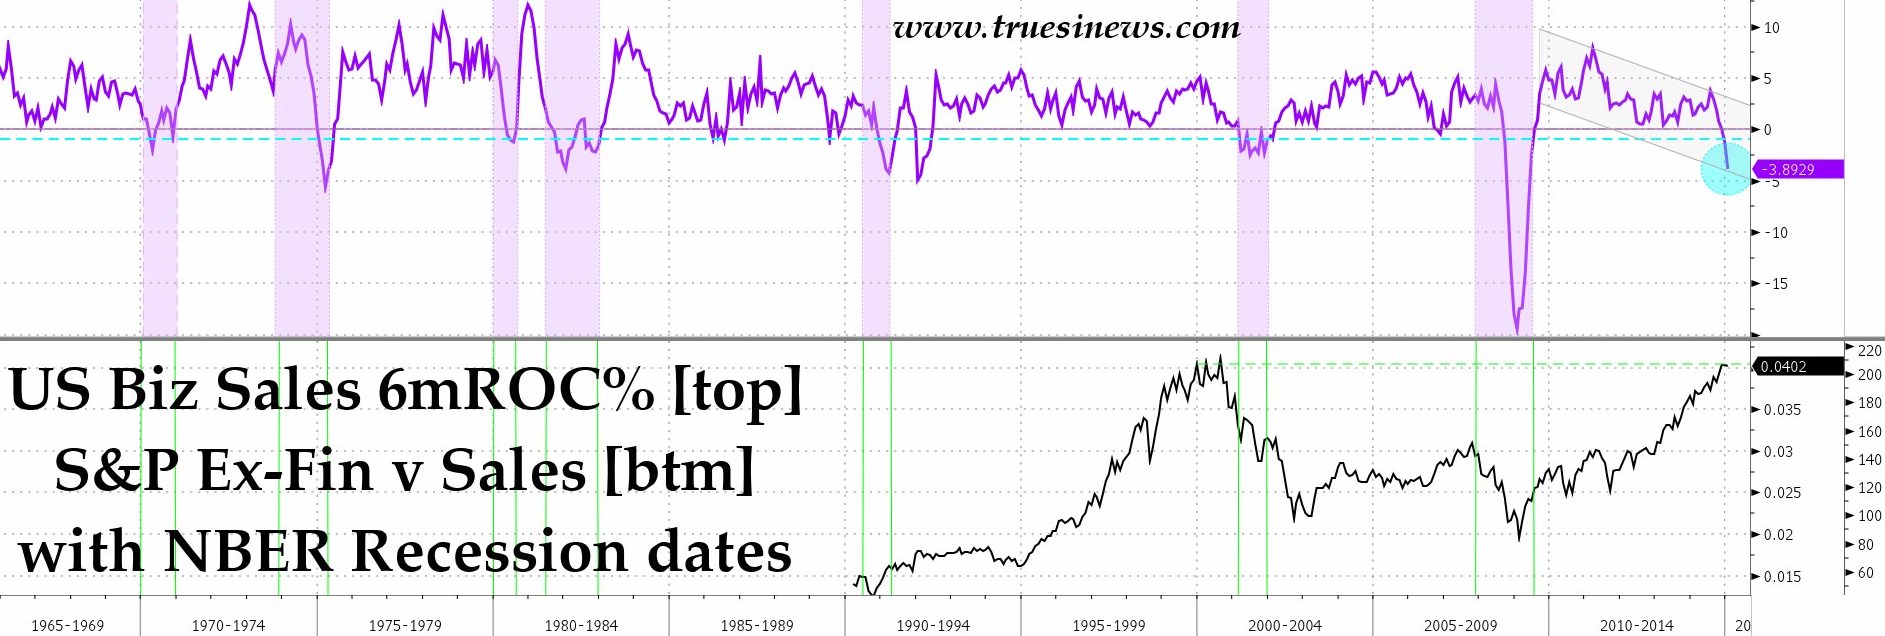
Similarly, the best, most timely gauge of US business sales has also slipped badly over the autumn and winter. Although these are nominal falls which are not so much the result of lower volumes but of declining prices – and so are not an unmitigated evil – the fact remains that no contraction of similar magnitude has taken place without the occurrence of an official NBER declaration of recession.
In that context, it should be noted that the S&P ex-financials index is now on a price:sales ratio only matched at the very peak of the Tech bubble. We await the Flow of Funds numbers later this week to see just how flattering all that QE-inspired, debt-financed buyback activity has also been for easily engineered EPS as opposed to hard-won ROIC.
Courtesy: Bloomberg
To conclude, one should be aware that even though the price of oil has been hogging the headlines, non-energy commodities are facing their own demons in this environment. For example, copper is just starting to show signs of fading once more after a vigorous and very necessary bounce off the lower bound of the profile laid down over the course of the past nine years (barring a brief interruption for the GFC itself). Were that barrier ever to give way, an enormous low-volume area would be encountered, stretching down almost 40% from its ceiling and thus offering exceedingly low resistance to a substantial, downward rotation.
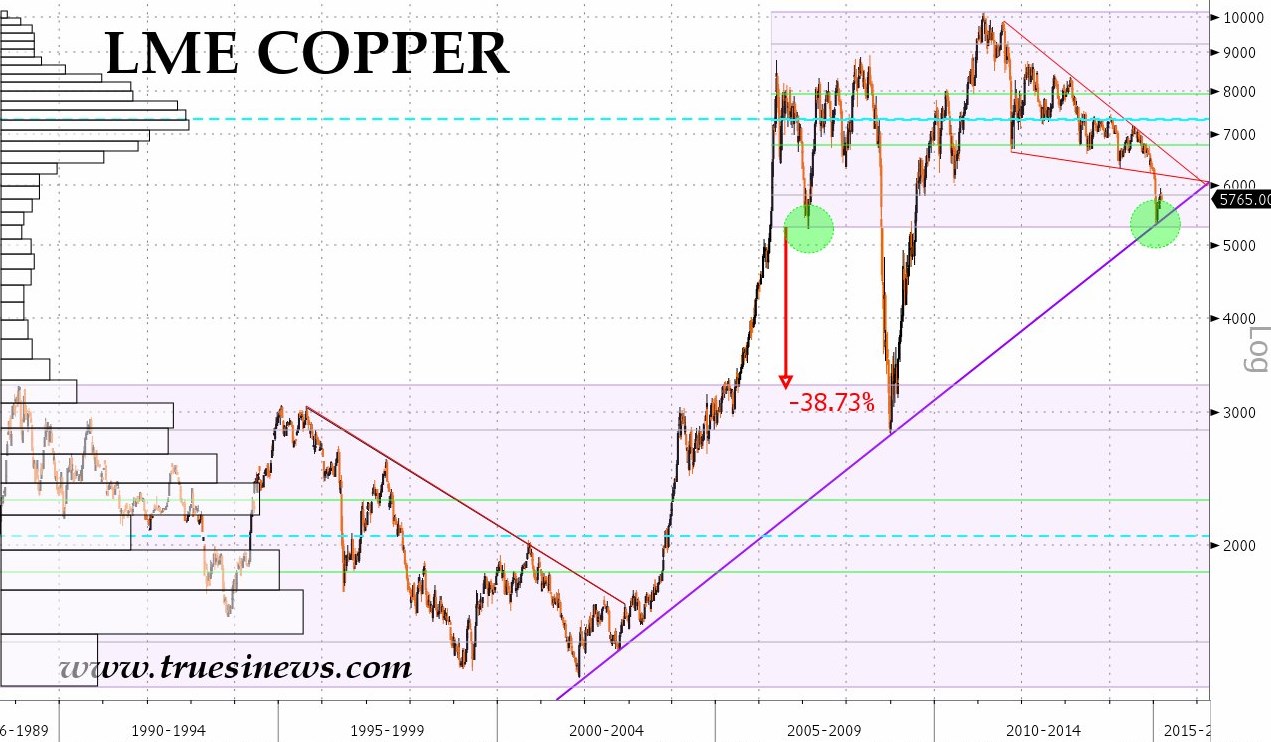
Courtesy: Bloomberg
Gold is also pushing its luck. Any serious probe lower here will not only take out the November low but also break the major trend line of the rally while allowing us to entertain swing targets drawn off the $1290 high volume price of around $1000 and even $800/oz. Caution!
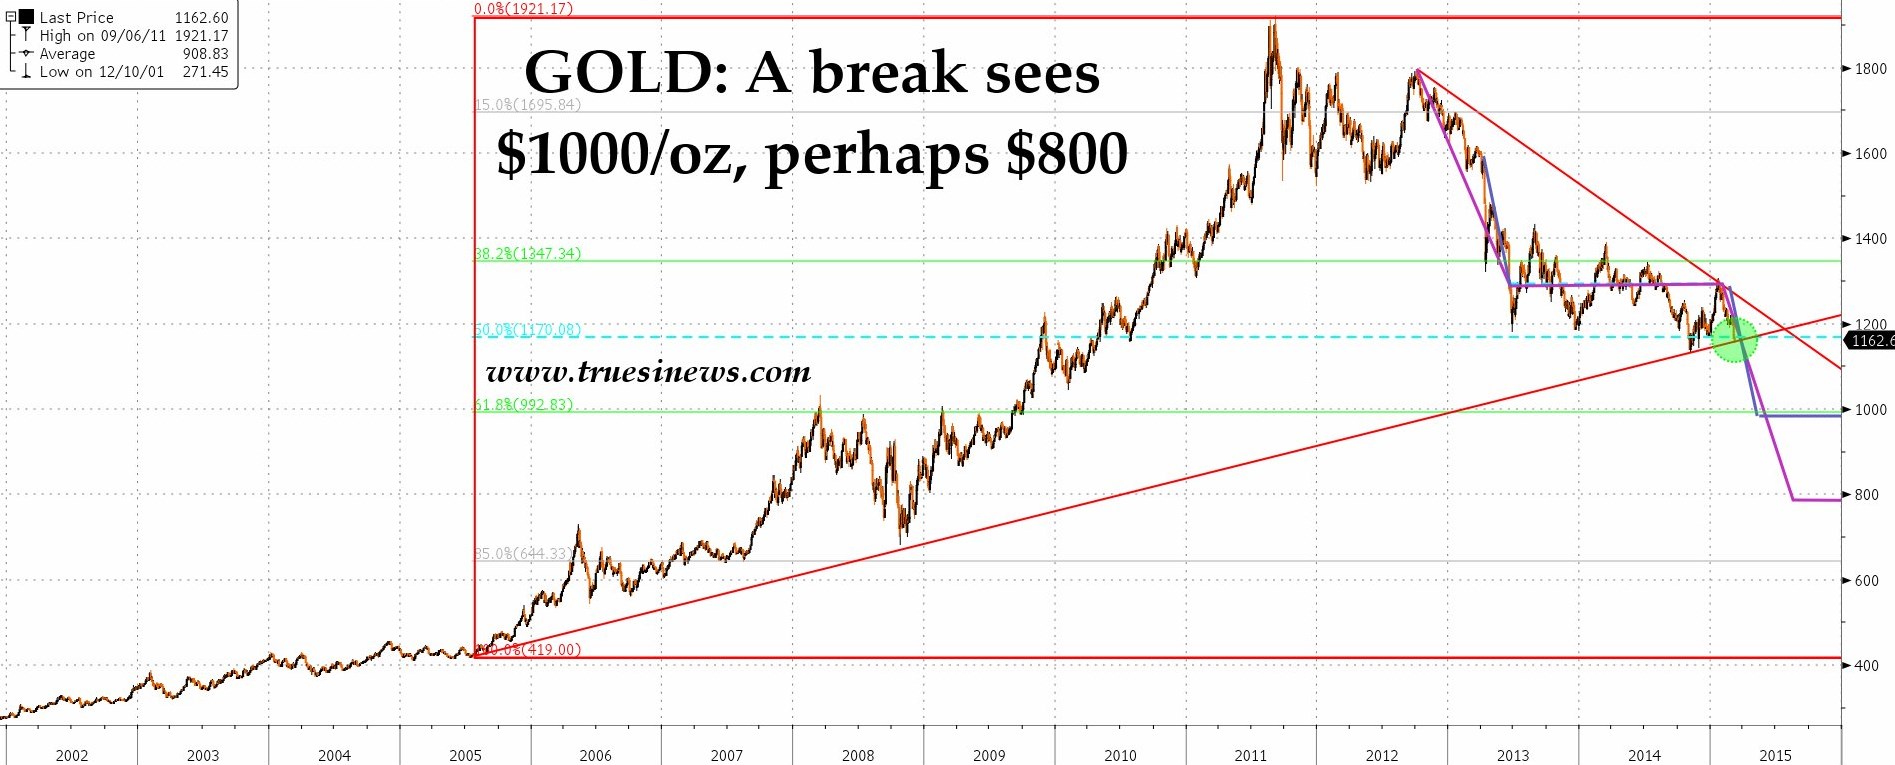
Courtesy: Bloomberg
NB The foregoing is for educative and entertainment purposes only. Nothing herein should be construed as constituting investment advice. All rights reserved. ©True Sinews