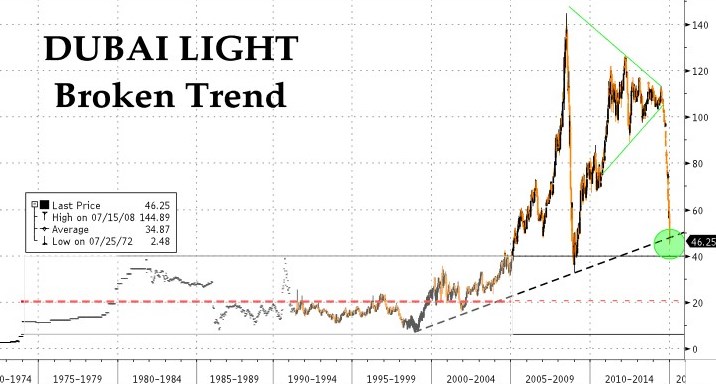
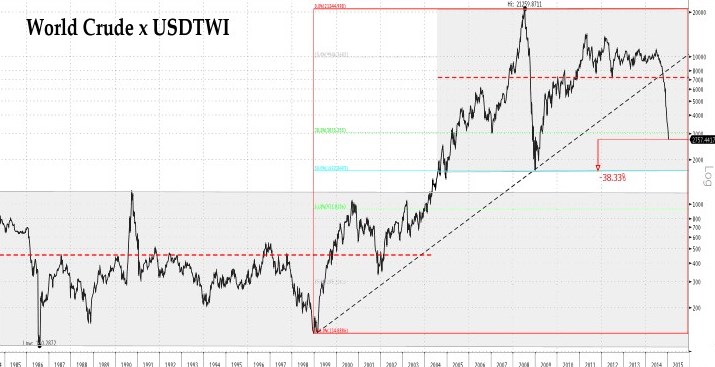
Though pausing occasionally to correct short-term oversold conditions, crude still seems locked in a one timeframe down market. As we suggested several months ago, the dominant narrative has become one which now finds reasons to project the move ever lower, conveniently forgetting all previous ideas of cost-of-production floors at $90, then $80, then $60 as each has been breached in turn.
The intriguing thing is that there has been no overall decline in net spec longs across the two main contracts for several weeks and $10s of dollars even as the curve has swung violently from steep backwardation to a similarly precipitous contango. This could be read as an indication that the bulls have not entirely abandoned all hope, but have extended out the curve in the hope that some combination of reduced supply and improved demand will rescue them later in the year, meanwhile consoling themselves that at least they should enjoy a substantial roll-down return in the interim.
Conversely, of course, the spec shift outwards also means that producers are hedging aggressively forward, itself a sign that they will not willingly curtail production even at these levels.
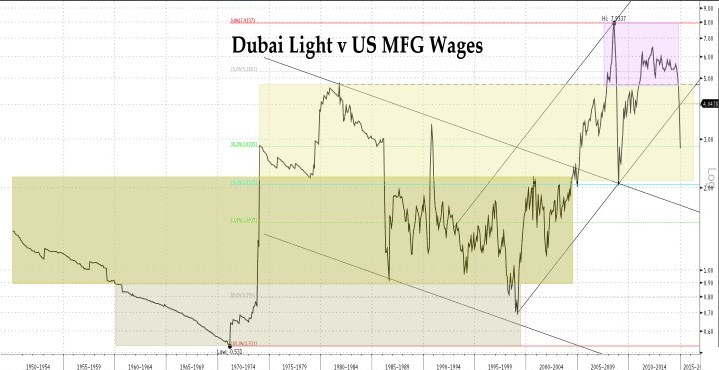
Whether we look at it outright, in USD TWI-adjusted terms, or deflated by, e.g., wages, trends have everywhere broken leaving one with the nagging feeling that oil, like so many other commodities before it, is doomed to complete a mean reversion to a long-term, nominal dollar average however irreconcilable that may presently appear with what we are being told about the consequences for the drillers.
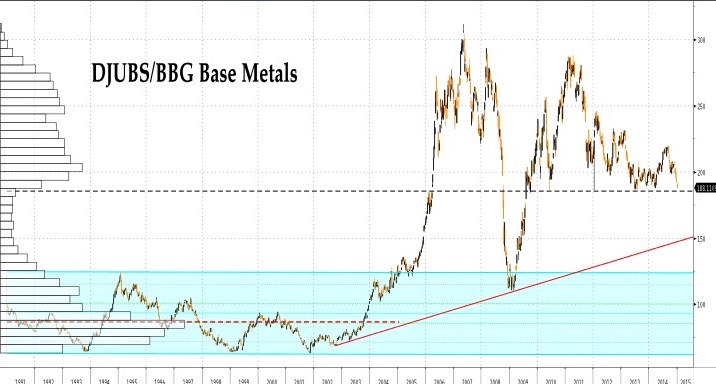
One thing that also catches the eye is that base metals as a group – loosely linked to energy prices over much of the so-called ‘Super Cycle’ – have not yet followed the latter in their descent, even though several individual charts have a formation which looks horribly just like that of oil on the eve of its plunge.
Relative to how they have traded in recent years, metals can derive little comfort from the picture below.
Nor, on an absolute showing are things much more cheery. A big short in copper, combined with a cash squeeze on the LME and expectations of Chinese strategic stockpiling at the lows may be helping the floor to hold for now, but that is an awfully sharp volume ledge from which to drop with precious little in the way of prior volume to impede another swoop to the upper bound of the old range, last visited in the GFC, if it should at last give way. Tic-toc goes the collateral trade timebomb as the dollar claws its way upward.
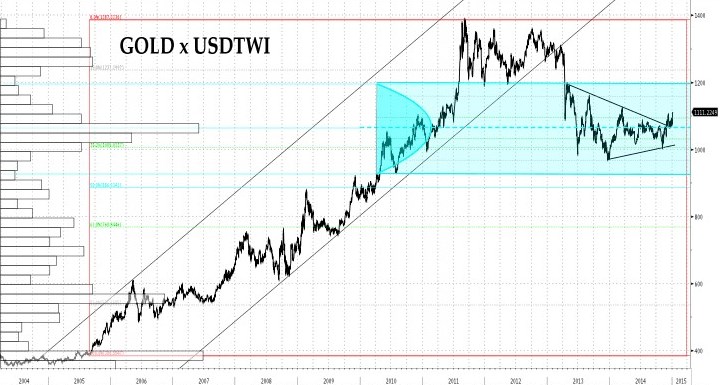
Gold, meanwhile, has seemingly found a base in the $1140/80 region even if any probes to the upside from there still lack full conviction. As is always the case when stress indicators (vols, basis swaps, and credit spreads) start to kick-up, gold is outperforming the industrials. Indeed, it is testing a major, three decade trend line versus oil as we speak.
In TWI terms, too, it is performing much better than it has done of late (meaning it is actually rising in terms of most non-dollar linked currencies). The real tension here comes from the fact that value is being laid down at progressively lower levels when read from the high (or better yet from the early-2013 break from the range which was defined by that high) – which implies that the correction has not yet run its course – and the fact that, read instead from the 2005 beginning of the medium-term move to $1900, this is simultaneously moving the pivotal longest line higher in the profile – from which we could infer that a major new, historic high lies in store.
Faced with such a disparity, it is important not to mix your interpretation of the two timeframes when trading it. Let the market show us which will come to dominate first before increasing exposures overmuch.
NB The foregoing is for educative and entertainment purposes only. Nothing herein should be construed as constituting investment advice. All rights reserved. ©True Sinews

