
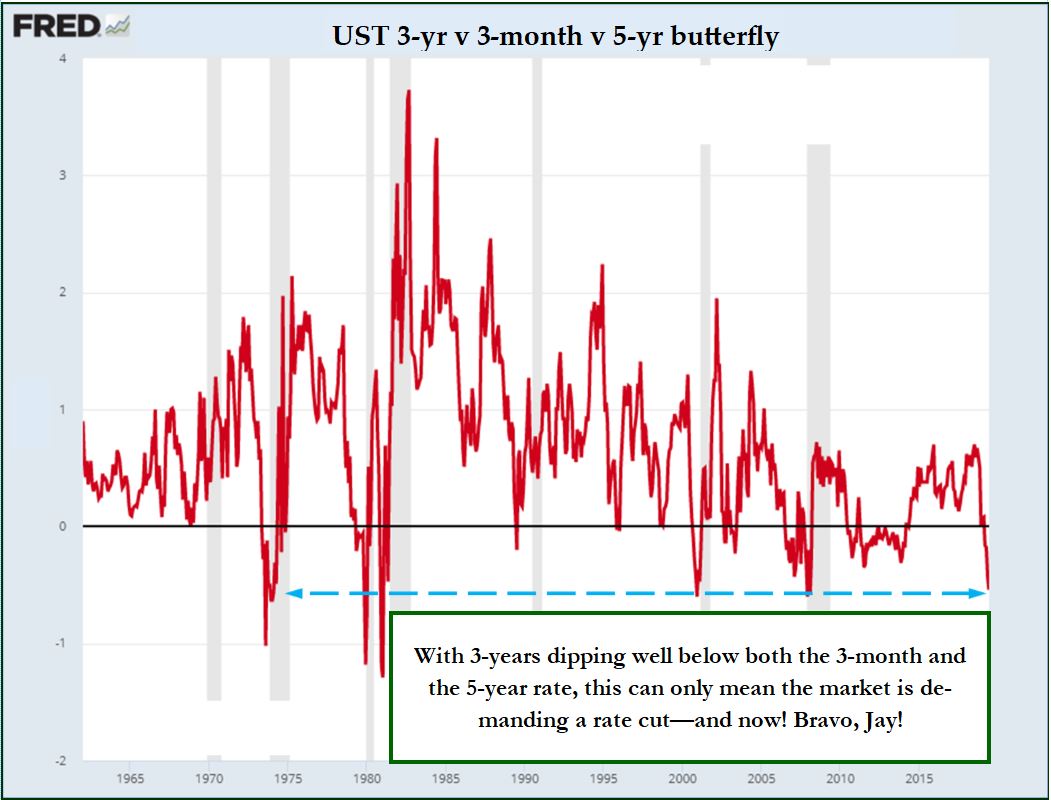
It was almost inevitable that, days after the front end of the US interest rate structure had undergone a 35 basis-point plunge, its sharpest one week fall in yield since the immediate aftermath of the Lehman Crisis, the key non-farm payroll data would also come in weak. [First published June 10th]
Although this particular number is highly statistically variable – not to say erratic – is later subject to frequent, large revisions, and is said to be a ‘lagging’ indicator – i.e., one which only serves to confirm what other, earlier measures should already have revealed – over time it has become THE main trigger for expectations of policy shifts and hence for market action and reaction. For all its faults, it thus bears close attention for its implications.
Taken at face value – and so ignoring the possibility for subsequent adjustment – the 90,000 net private job additions last month were less than half the post-GFC recovery average increment of 195,000 and were enough to make the last four months the worst such stretch since the spring of 2012, seven long years ago.
Combining the count of total hours worked with the wages paid for such labour (what we term the ‘wage fund’), the last trimester now stands 4.9% above that recorded a year ago. As such, it has registered the slowest rate of increase in the past 15 months, the first year-on-year decline in over two years, and a marked deceleration from last October’s 11 ½-year high of 5.6%.
If hardly yet a number characteristic of outright recession, it does provide further evidence that the autumn of last year marked something of a high-water mark for the juggernaut which is the mighty US economy.
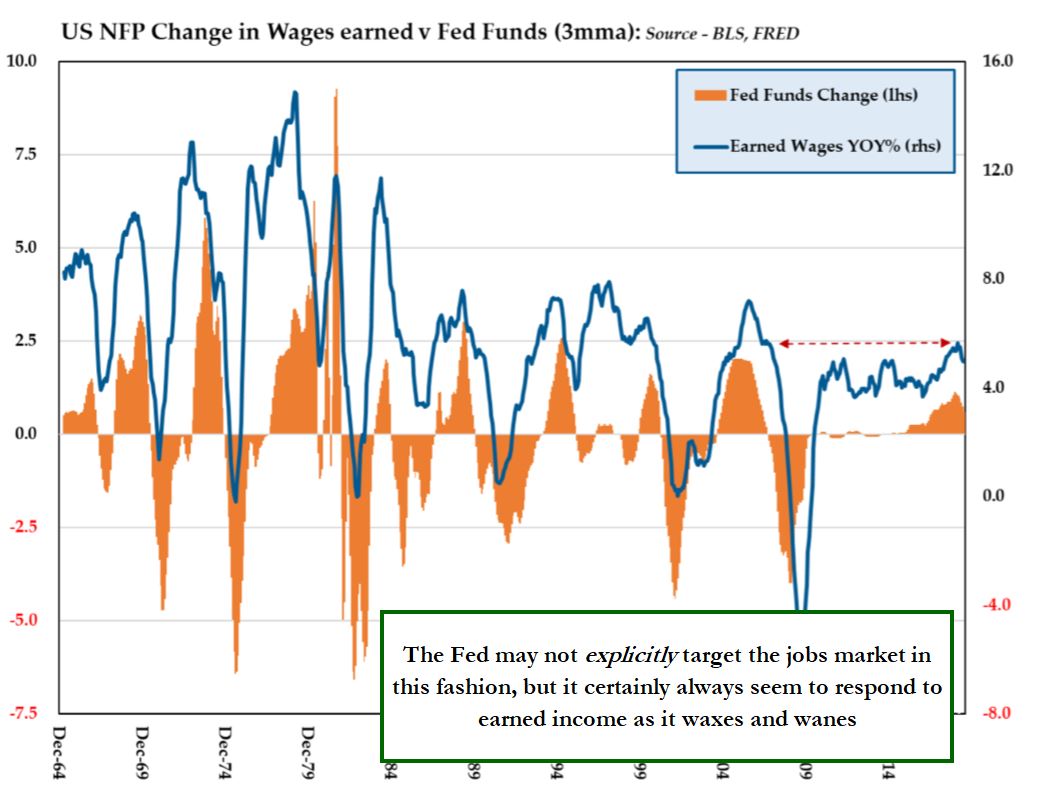
Fed funds have long tended to move with earned wages
Among the several indicators which have since been pointing in this same direction, in QI, manufacturing revenues grew a bare 0.7% yoy after hitting a 6 ½ year high of 8.5% last summer. Trade across the nation’s borders was running equally slowly, having touched almost 9% yoy last spring. Closely allied to this, the key ISM survey has slumped a point a month for the past 9 months, taking it far below the 15-year highs set in August in the kind of slide not seen since the disasters of 2008-9. Private construction spending has slumped 4.3% yoy – its poorest score in 8 years – while, against an admittedly tough comparison, CASS freight shipments are down 3.2% and intermodal rail loadings are off 2.9% versus 2018’s levels.
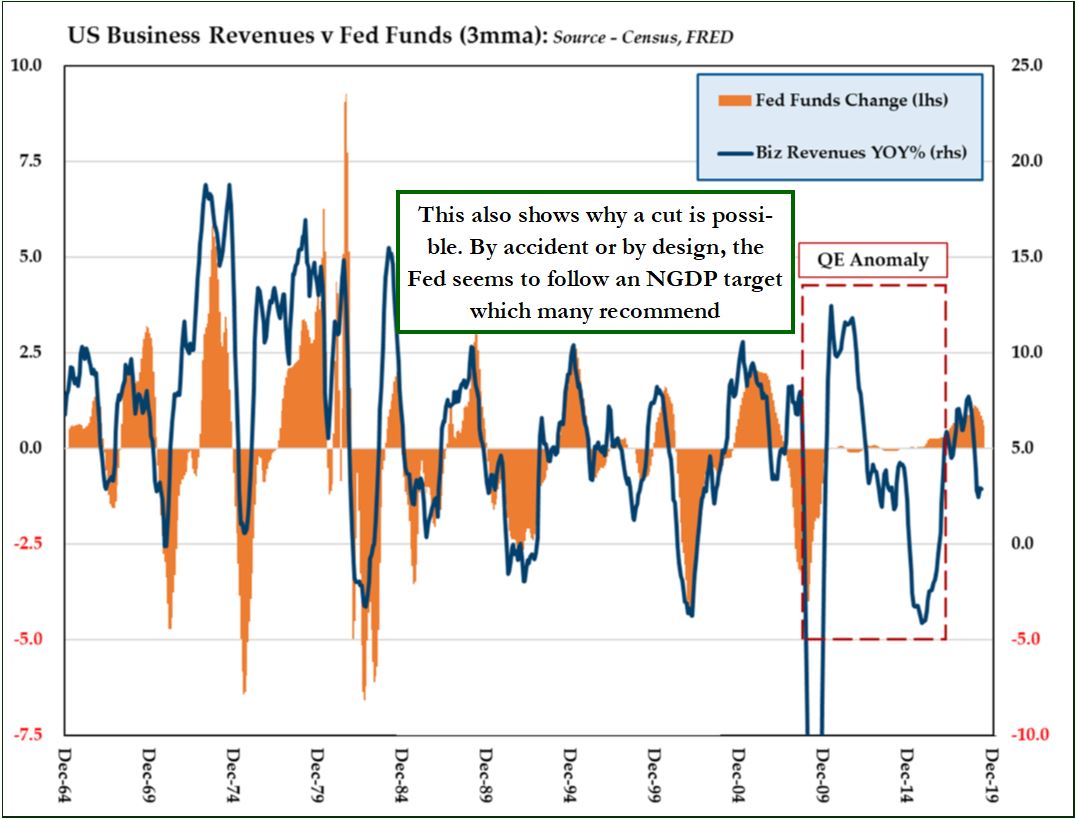
The Fed’s closet NGDP targeting revealed…
The one resilient spot has been the service industry. There, non-financial sectors registered 5.1% yoy in March, with finance adding a still lively 6.8%, but the overall combination with productive industries nevertheless now averages an anaemic 3.3% – a rate also reflected in the path of S&P500 revenues themselves (once you adjust the headline numbers for a falling share count). As such, that latter is the slowest seen since the ‘hidden recession’ of 2015-16, a progression barely positive in real (after-inflation) terms, and a far cry from last June’s torrid +10%.
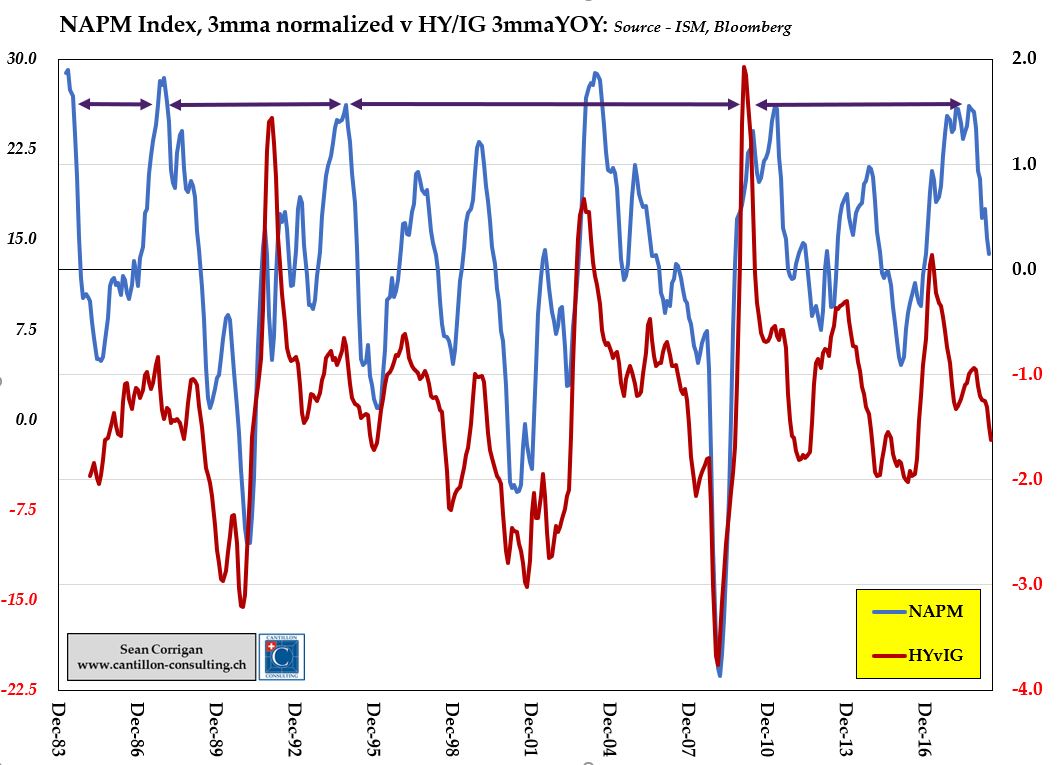
Relative declines in HY offer more evidence of economic weakening
With regard to the more indirect pointers given off by various financial quantities, that closely-observed inflation level implied for five years hence which is hidden in the minutiae of the US Treasury market moved smartly below the Fed’s 2% target level and high-yield bonds decisively underperformed investment grade equivalents after a 100bp run-up in the spread between the yield on the two categories. To cap it all off, money supply gains and the growth in banking credit remain unhelpfully sedate, as they have done for some good few months now.
The shift which this witches’ brew of tariff wars, Fed jawboning, poor macros numbers, and extreme speculative positioning in interest rate markets prompted was, as we said, dramatic.
10-year bond volatility jumped on the CBOE from mid-April’s lows, deep down in the first percentile of it entire 16-year range, to last week’s 51st. Two-year notes, whose narrowing difference to the Ten-year had been threatening to extend the so-called inversion of the yield curve all the way to its front, saw that dwindling spread shoot up 15bps to a six-month high as the market started to scream for an immediate Fed rate cut. Even a contract as imminent as September eurodollars soared an impressive 35 tics, to come within a whisker of 2% implied rates and hence to incorporate the better part, not just of one, but two regular-sized reductions to be delivered before the summer ends.
All eyes on the FOMC…
A year further on, and two more cuts were also built in to the term structure and so present Chairman Powell and friends with something of a dilemma at next week’s FOMC meeting: validate the market’s stance and risk a further, destabilizing surge in a stock market which is, for all the angst, only a few percentage points below its all-time high; or take a pin to the bubble of expectations and suffer a rout in a bond market already trading at some of the most negative real yields in nearly four decades, while unleashing a concomitant surge in the dollar to the dismay of foreign borrowers and commodity traders everywhere.
Given that the worthies at the Federal Reserve would attract far more opprobrium for the latter outcome than the former, the smart money would surely be betting that the bond market will not get its way, once again, next Wednesday.