
When it comes to that key commodity oil, there are three main features of the market to watch alongside the price: namely, the spread between WTI and Brent and the shape of the two futures curves. Visible inventory levels provide the main and most frequent ‘fundamental’ data we have (though these are not always straightforward to interpret ) while the (delayed) weekly insight into futures positioning gives us another excuse to read the runes. [First Published May 29th]
Taking these in turn, we see, as we do elsewhere in the markets, that sentiment changed abruptly in the last week of April, with WTI topping out at close to a six-month high at $66.50/barrel and Brent doing likewise at $75.60, the spread between the two at that juncture being of the order of $9/bbl.
As is frequently the case, the latter stages of the 50%+ rally which had taken both contracts from the lows of 2018’s fourth quarter sell-off had seen the front months outperform the more deferred maturities. July WTI moved from a 60¢ discount (a ‘contango’) to a 75¢ premium (a ‘backwardation’) over October while Brent – subject to a somewhat different supply dynamic, thanks to the imposition of sanctions on Iran and the ongoing collapse of Venezuelan production – moved by a similar amount, but this time from near parity to a wider July premium of $1.60 which was reflective of the concerns about availability in the back part of the year.
Simultaneously, the ‘hot money’ grouping of hedge funds and CTAs almost quintupled their net WTI position, taking their long-short ratio from a modest 3 to 2 to a highly imbalanced 16 to 1. At the same time, Brent saw a near trebling of net bullish positions ending at a similarly one-sided 16:1 ratio just as the market peaked.
Alas, all ideas of a profitable ride on up to and through last October’s 5-year highs (approaching $80/bbl for WTI and $90 for Brent) were quickly dashed as fears mounted that the US-China trade war would tip either or both countries into an outright recession at the same time that anxieties about developments in the Eurozone were also on the rise.
Risk Off, as they say.
With disappointed longs scrambling for the exits and the first intrepid shorts adding to their previously minimal wagers, 100 million barrels equivalent of WTI was taken off the scales – reducing the long/short ratio to what is a still-elevated 7 to 1 at the time of the last regular report for value May 21st. Brent, for its part, has seen only limited liquidation over that horizon, shedding a mere 20 MMbl of net longs—around 5% of the total—and leaving a lofty 13 to 1 bull/bear skew in positions with which to contend.
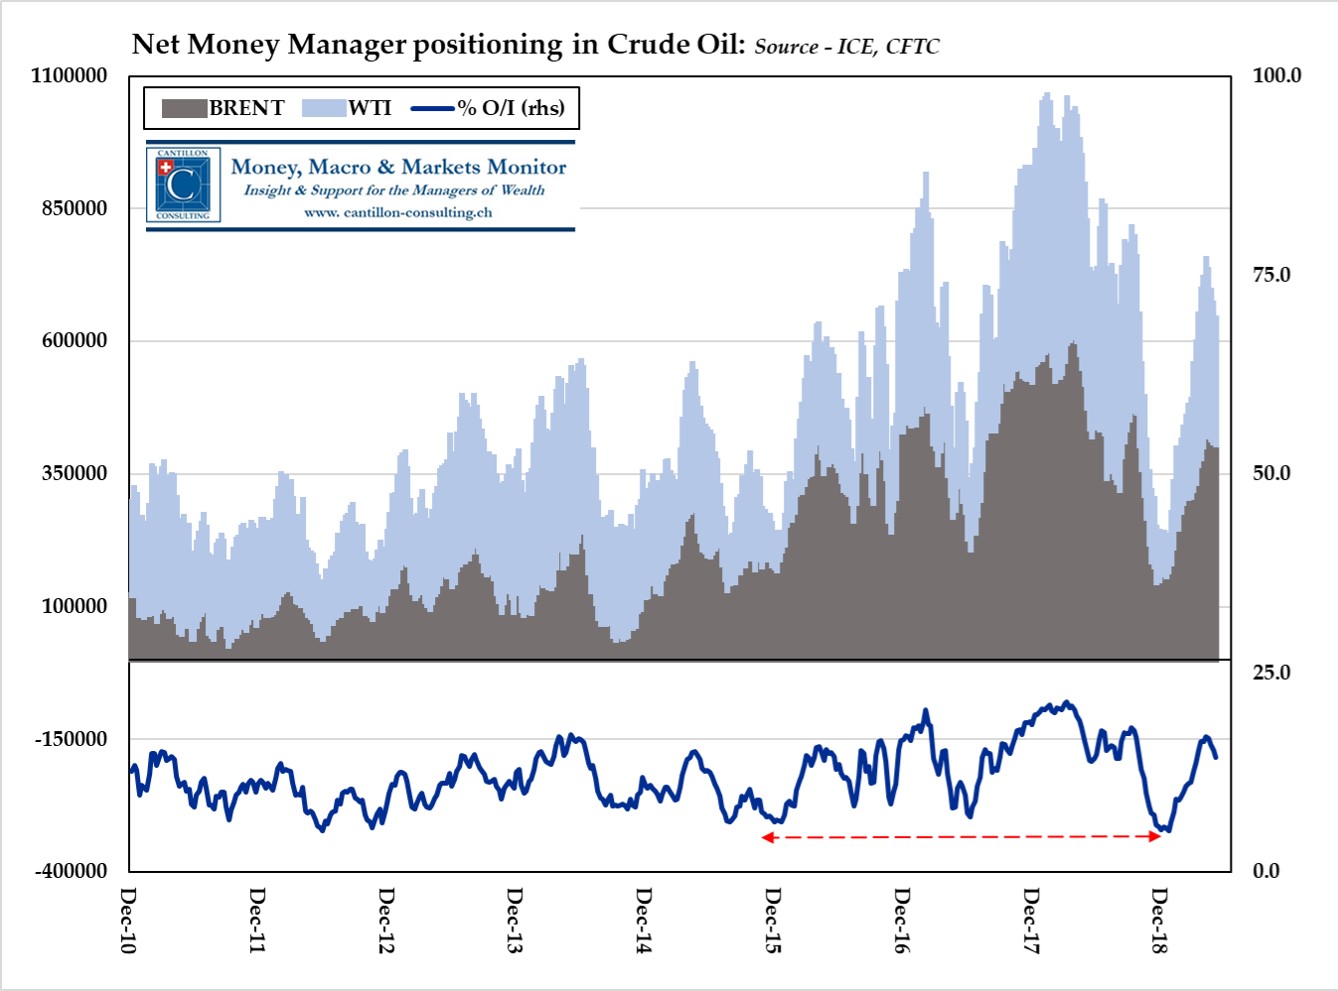
Hot Money: Long and Wrong?
As one might expect, that contrast has widened the spread between the two contracts to almost $11/bbl for the near expiration. Meanwhile, the brunt of the hot-money selling in WTI has also taken its toll on the curve, hammering July back down to 35¢ below October once more – a move aggravated by a coincident 5-week addition to US inventories which has equalled 2012’s record seasonal build and which has therefore left traders fretting about a possible supply glut in the pipeline constrained shale fields of Texas and Oklahoma.
Further underlining the differing expectations between shale oil-supplied America and a naval-blockaded Middle East, Brent’s curve has actually inverted further, doubling the backwardation to a statistically rare ~$3 even as front month prices have slipped on an outright basis. This all serves to emphasise the degree of expectation that real supply difficulties might be felt with the onset of the winter.
From here, it is not hard to see WTI trading back down to the median/modal value of the past 5-years of around $52/bbl.
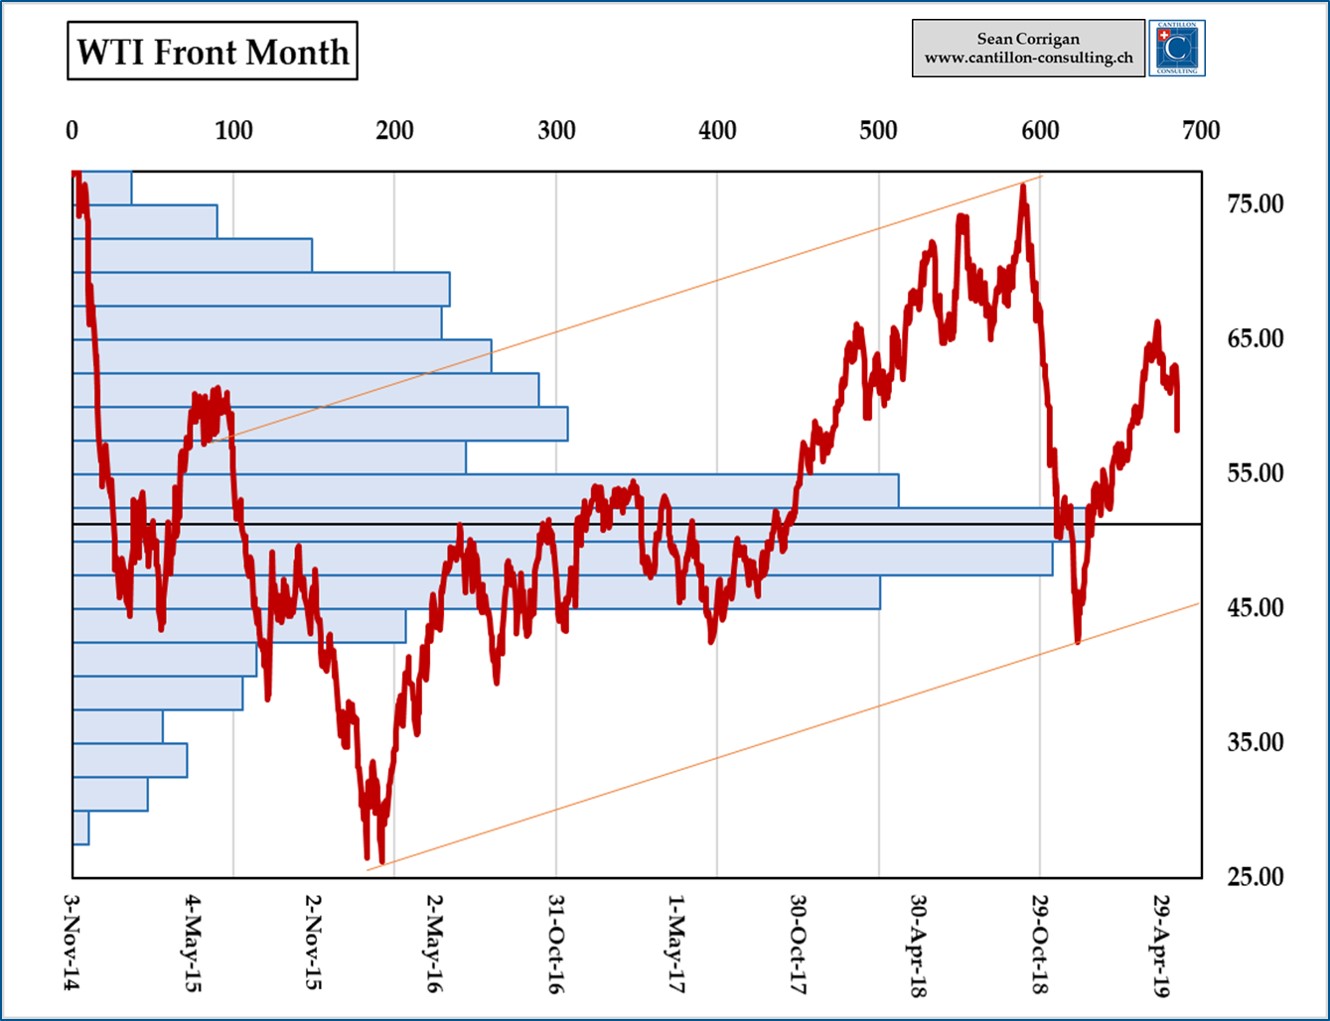
Mean Reversion in Sight?
At that level, there would be little daylight to the EIA’s latest estimates that the all-in cost of Permian Basin production amounts to $48/bbl, so rigs should be idled, supply quickly reduced and – barring yet more bad news in the wider economy – hopefully putting a floor under the slide.
To close, those looking for an oil-related trade in the bond markets should note that spot oil prices are the best indicator of what developments to expect in the crucial forward break-even inflation rates to which both the Fed and the big market players pay attention and which are derived from a comparison of yields on index-linked US Treasuries with those on the plain vanilla kind. Oil (and, indeed, industrial commodities in general) also tend to move inversely to the spread of junk (high-yield) bonds over those same Treasuries (strong economies, less perceptible credit risk and vice versa).
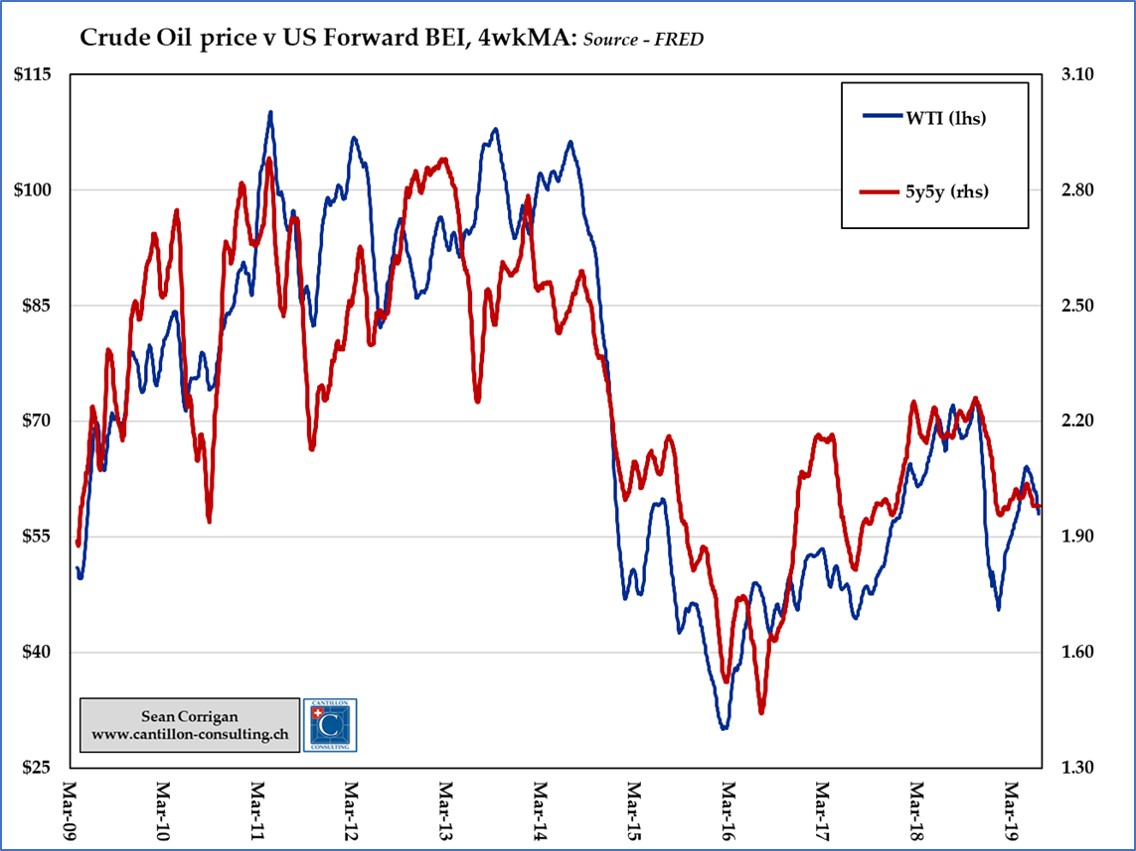
Future Inflation v Spot Oil: Crazy but True
Thus, fixed income traders wanting to take a punt on falling oil prices should sell the latter and buy the former and then go out and fill the gas tank more cheaply when their profits roll in.