
Much predictably fatuous comment has been devoted to the fact that, to the extent that the US is facing any difficulties at all outside the oil patch, at present these ‘only’ affect manufacturing—a sector which , as any fool knows, accounts for a mere 12% of GDP. Ergo, we are told, while employment in general holds up and consumer spending is maintained, a recession is not to be countenanced—a bill of clean health which conveniently supports the sell-side’s fingers-crossed contention that stocks are cheap and that credit is beginning to offer up real bargains for the man brave enough to dip his toe back into the waters.
We Austrians, however, tend to hold a different view of the pivotal role of what we call ‘higher order’ sectors in the economic machine, while recognizing that the modern-day institutions of Big Government and mass, end-consumer finance can partly mask their workings in a manner which would have been alien to the theory’s early architects.
To acquire a feel for this argument, we must look beyond the final-use fixation of the GDP arithmetic and cast our gaze instead at wider measures of activity. The charts presented here are an attempt at achieving such an overview.
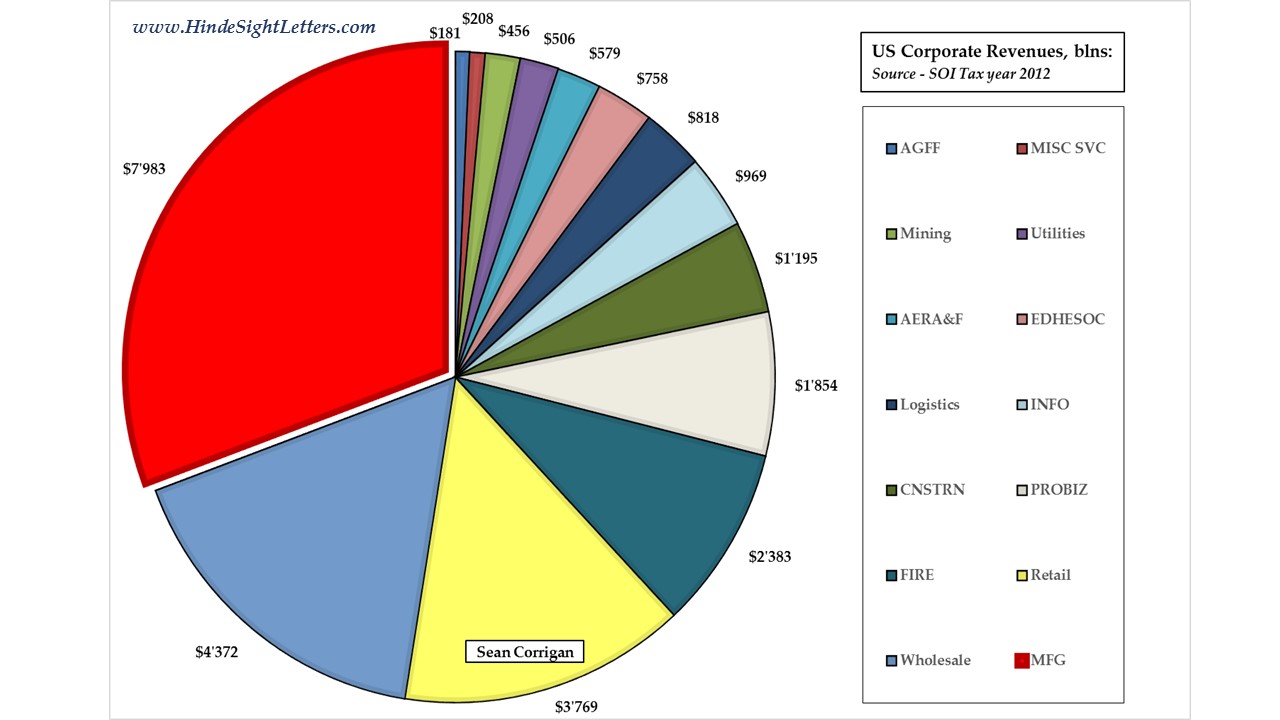
The first shows the distribution of business revenues compiled from almost 6 million corporate tax returns in 2012 (the latest period for which we have available data). Out of a total of $26 trillion in sales (a number, please note, while far from including all economic activity in the country is already some 60% greater than that same year’s GDP estimate), the manufacturing sector’s $8 trillion contribution accounted for the single biggest fraction, namely 31%. In terms of those forms of business spending which are registered under the rubric, ‘cost of goods’, manufacturing was further responsible for 36% of the overall sum. Likewise, it made up 28% of all pre-tax profits. In all bar the last category, where it was beaten by c.10% that year by Finance & Real Estate, these were the largest shares of all the major sectors.
Even in the Uber economy, still the Big Daddy of them all…
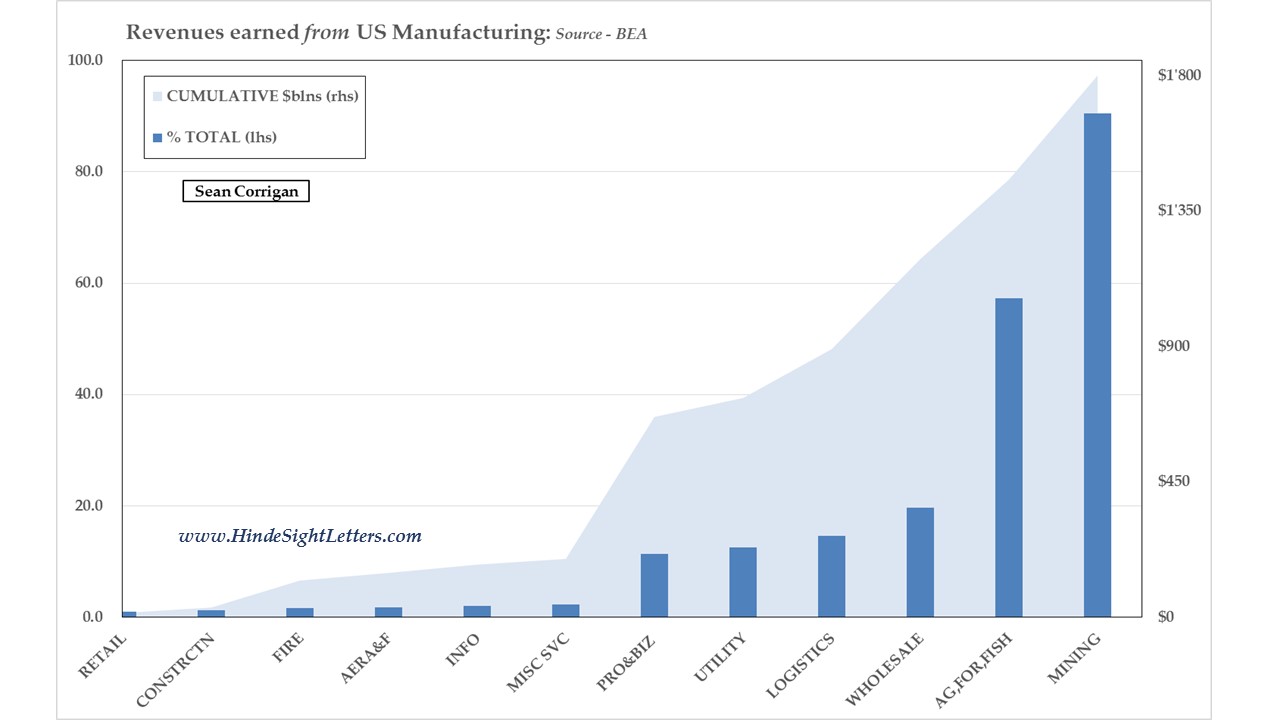
Turning to the second graph (and this time using the BEA’s somewhat different methodology which seriously reduces the weighting of retail and wholesale), manufacturing itself consumed almost $2 trillion of the ‘gross output’ of other businesses, further extending its footprint. Can you imagine how they must be feeling, right now as the country’s makers of things catch something of a chill?
…and a Buyer, not just a Seller
It should be borne in mind that, the BEA’s numbers show that B2B spending (which is often highly discretionary in nature) makes up 2/3 or so of manufacturing’s customer base – with around a half of originating from other manufacturers in their turn. In addition, capital intensity here is generally higher and timelines for ROI therefore longer; the nature of the goods being produced is typically highly specialized – and hence highly user-specific – meaning their place in the ‘national assembly line’ is much more circumscribed than is the case in many other areas of commercial life.
All in all then, this sector is not just the largest, but also the most variable and hence the most susceptible to booms and busts.
‘Only’ manufacturing, indeed!
THE ABOVE IS AN EXTRACT FROM WORK WHICH APPEARS AS THE SEMI-MONTHLY ‘MIDWEEK MACRO MUSINGS‘, AS OFFERED ALONGSIDE THE FULL IN-DEPTH MONTHLY, ‘MONEY, MACRO & MARKETS‘, BOTH PUBLISHED BY HINDESIGHT LETTERS.
PLEASE CLICK HERE FOR MORE DETAILS
NB The foregoing is for educative and entertainment purposes only. Nothing herein should be construed as constituting investment advice. All rights reserved. ©True Sinews