
More than half a century ago, in his role as an advisor to the men responsible for trying to set Taiwan on the road to prosperity, a redoubtable economist called Sho-Chie Tsiang argued that the monetary authorities should stop suppressing interest rates and directly rationing credit and should move instead toward a more market-oriented system where real rates were sufficiently elevated to encourage productive saving.
His reasoning was that the existing combination of what we might call Z(Real)IRP with ‘macro-prudential’ control was plagued with several significant drawbacks.
Firstly, rationed credit tended to be crony credit – with only the politically-favoured having any hope of persuading the banks to lend to them. Secondly, the erosion of purchasing power suffered by any one depositing money in the bank at the prevailing yields meant that savers looked for other outlets for their surpluses, such as property and precious metals, neither of which did much to augment the stock of productive capital. Thirdly, this lack of genuine saving meant that all extra funding had to rely on inflationary credit creation and thus necessitated even more macro-prudential monkeying with the price mechanism. Fourthly, anyone outside the charmed circle of accepted borrowers – which tended to mean anyone with a hint of genuine entrepreneurship – had to raise funds in a quasi-illicit and certainly non-transparent manner and so had to promise exorbitantly high ‘curb’ rates of interest to compensate their lenders for the extra hazards involved.
Tsiang argued – and was soon to be proved totally correct in his assertions – that by allowing the rate of interest to find a level where market for funds cleared – essentially where the impulse to thrift intersected the expectation of profit – not only would all these disadvantages be eradicated, but the funding rate applicable to the WHOLE economy, as opposed to that charged to the privileged few, would be lower on average, not higher, as the risk premia associated with the ‘shadow’ market were removed.
In the decades after the Second World War, Taiwan, not entirely coincidentally, transformed itself from a backward, low-value added, crisis-wracked basket case into the economic prodigy to which we still look for so many of our high tech gizmos today.
The reason for the history lesson should be obvious if we consider that much of the same reasoning is relevant to mainland China today, even if the scale of the problem is somewhat larger in a country of 1 1/3 billion people.
Beijing knows that it cannot afford to persist with ‘business as usual’, that the ‘three overhangs’ relating to past over-expansion and misdirected effort have to be overcome while moving to the ‘new normal’ of less force-fed growth-for-growth’s sake. The issues with this are twofold: will the authorities stick to their course, even when the waters get choppy and, if they do, can they then hope to bring the ship of state safely into harbour before the leaks springing from its every timber send it to the bottom?
On the monetary front alone, the issue is fraught. The PBoC, as everyone knows, was moved to cut the required reserve rate a week or so back and so sparked a renewed clamour for further, substantial easing even though the main reason for the reduction was technical: the traditional Lunar New Year cash squeeze was bumping up against the very substantial reserve drain occasioned by the last few months’ sizeable forex outflows.
[CLICK TO ENLARGE ALL GRAPHS]
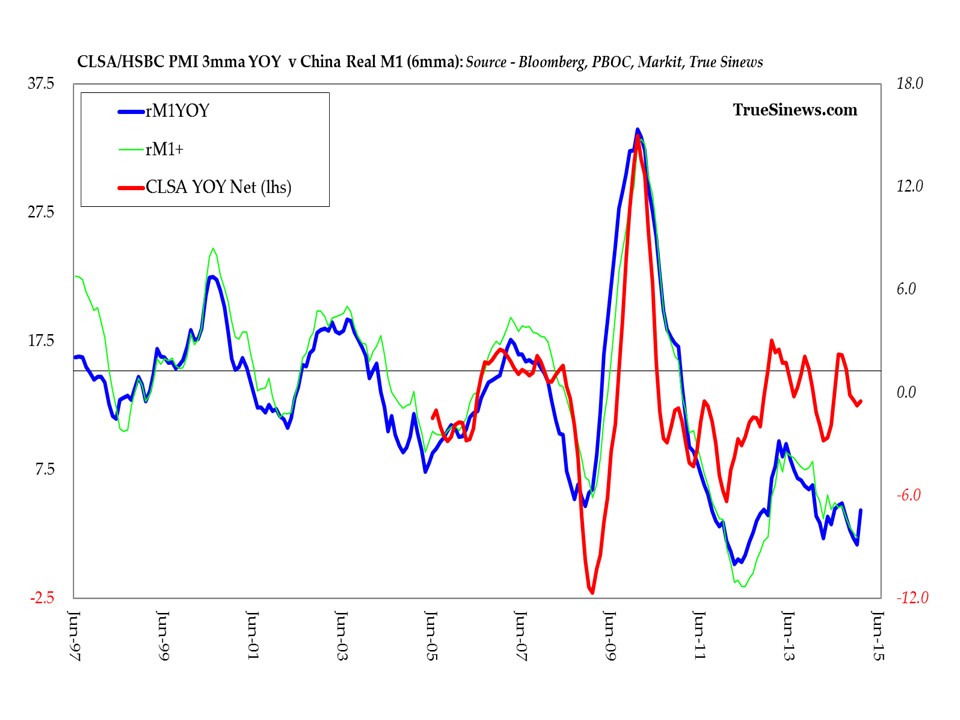
Against such a backdrop, the monthly money and credit numbers were exceptionally hard to read. TSF rose, but less than it did in each of the past two years. Loan growth, however, was the second highest on record. On the other side of the balance sheet M2 slowed to a multi-year low increase of 10.2% (even though overall deposits jumped by the most on record!) and yet, within that total, M1 money remained unchanged in a month in which it often falls so its rate of climb therefore rose to a 20-month high of 10.6%. Confusion confounded, indeed!
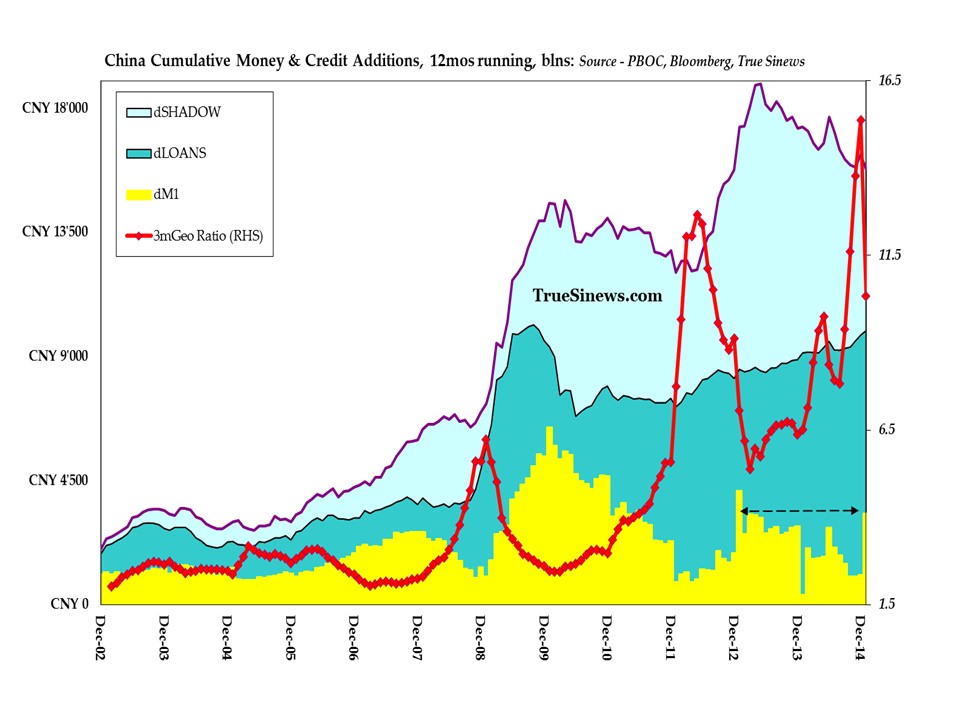
What is key here is that Lui Lei of the central bank came out to argue that any intervention should henceforth only be aimed at alleviating liquidity shortages, not at fostering hothouse growth, while Xu Lin of the NDRC hinted that the latest Five-year Plan would insist on a ‘floor’ for growth of a mere 6.5% – a significant psychological climb down from the economy-doubling 7-handles to which the regime has heretofore grimly clung. Guan Tao of the SAFE next went so far as to make explicit reference to the parallels between his country today and its Asian neighbours back in 1997 on the eve of their great crisis (and he should know: $10 billion+ leaked out again in January, his employers had just revealed).
Courtesy: Bloomberg
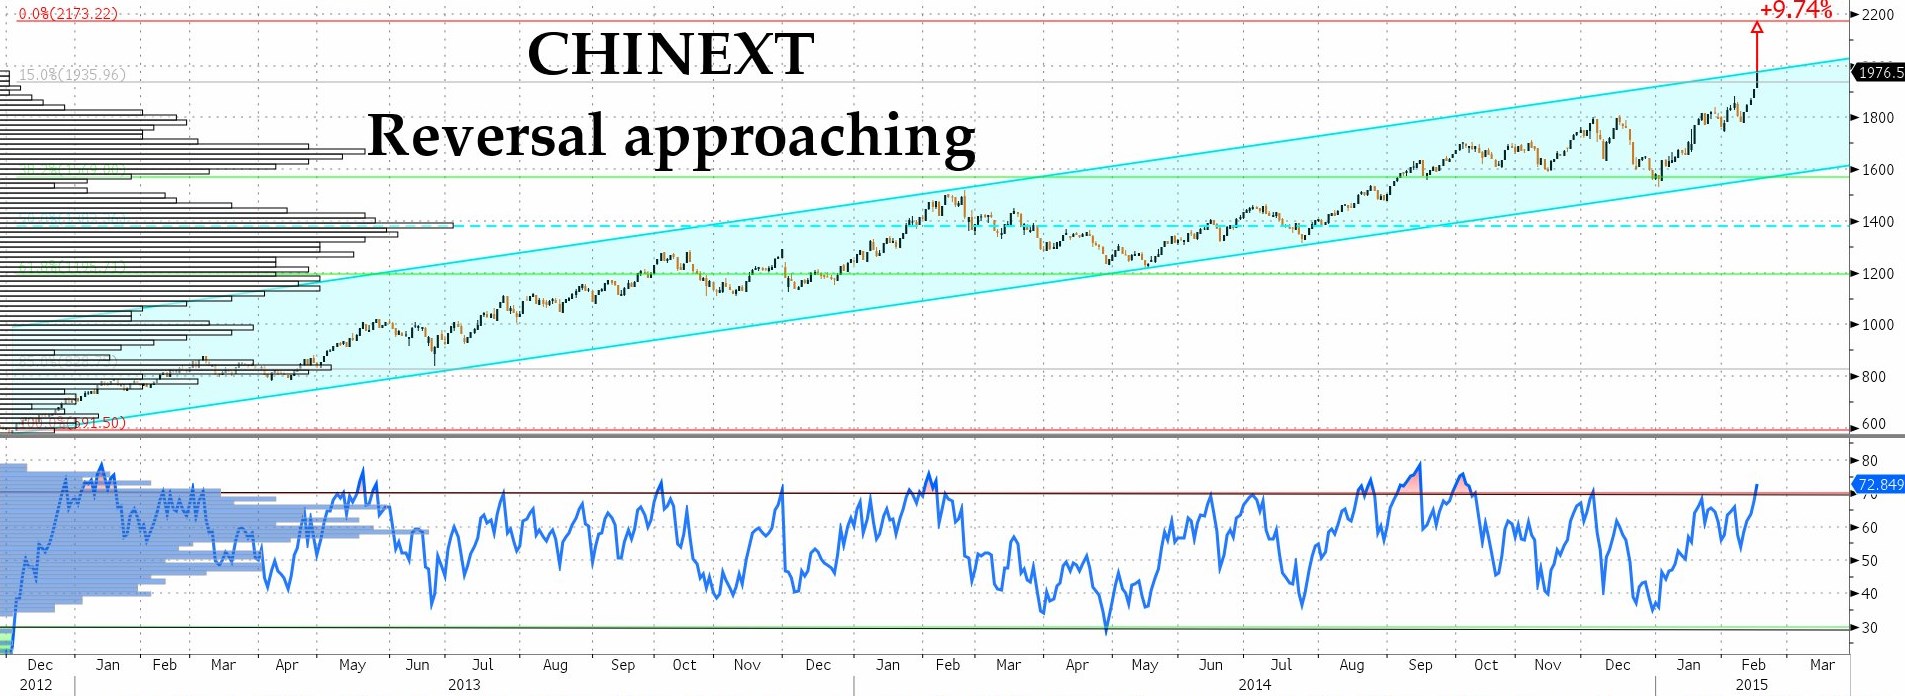
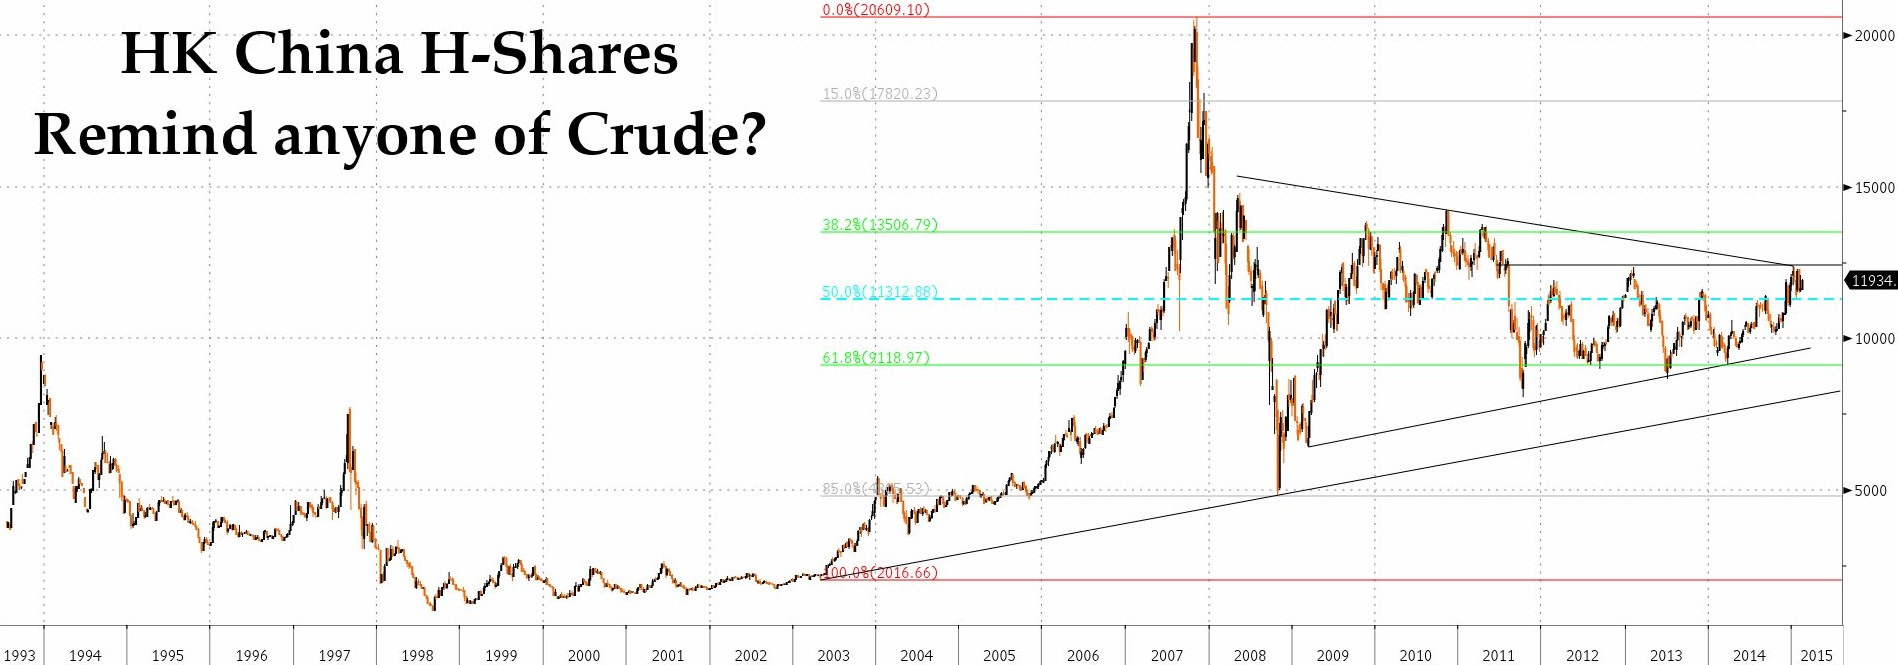
For all the worries, this was not enough to prevent the ChiNext from making a new high – taking its run to 233% these past two years. We suspect, however, that it will pay to sell a reversal somewhere in the next 10%. We are also intrigued by the similarity between the HK H-Shares chart and that for pre-collapse crude – or, for that matter, between the index and all manner of commodity-related indices in recent months.
Courtesy: Bloomberg
It is also fascinating to watch sentiment start to dissolve among the US punditry. As the newsflow become more nuanced, market participants have become schizophrenic with regard to oil prices – lower is ‘a tax cut for the consumer’ but is also about to blow up the junk bond market, depending on who is talking. The Dow, for its part, has rallied on cheap energy, but also rallied on a rebound in oil prices which was said to signal continued demand. So long as it rallies, one supposes…
Amid a stretch of numbers which, aside from those concerning employment, were somewhat disappointing to a consensus only lately set four-square behind the thesis of US economic triumphalism, some unusual attention has been paid of late to the lacklustre retail and wholesale sales numbers – mainly becuase they, too, looked weak.
For our part, since these are the nearest thing we get to a timely measure of economy-wide revenues (and hence not just to an NGDP number, all you market monetarists and Neo-Hayekians out there, but to an NSOP – a nominal structure-of-production flow) we tend to pay close attention to them as a matter of routine. What is at issue here, however, is the very fact that these are nominal numbers and are therefore hard to interpret when large, supply-side price changes are underway, as is arguably the case in all things related to natural resources as well as, for the US with its persistently strengthening currency, to imported goods of a more general character.
Since it is the sales margin that ultimately counts for the success of an enterprise, the first thing we need to assure ourselves is that falling revenues need not be wholly bad, as long as costs fall commensurately alongside them. There are, as ever, several caveats to this broad pronouncement.
Firstly, we have to hope that the aggregate decline in selling and buying prices does not mask too great a disparity between conditions in one business and the next. We must also beware the fact that any resulting windfall for one is not ruined by the shortfall for another when the impact is not a simple matter of addition and subtraction but acts in a non-linear fashion – e.g., through its implications for the credit structure. Finally, we have to wonder how the necessary fall in nominal costs will be achieved when it comes to those associated with the payroll. We should all recognise that real wages are what determine our standard of living, but we must also bear in mind that it is the nominal ones over which we fight and for whose maintenance jobs are often sacrificed.
Courtesy: Bloomberg
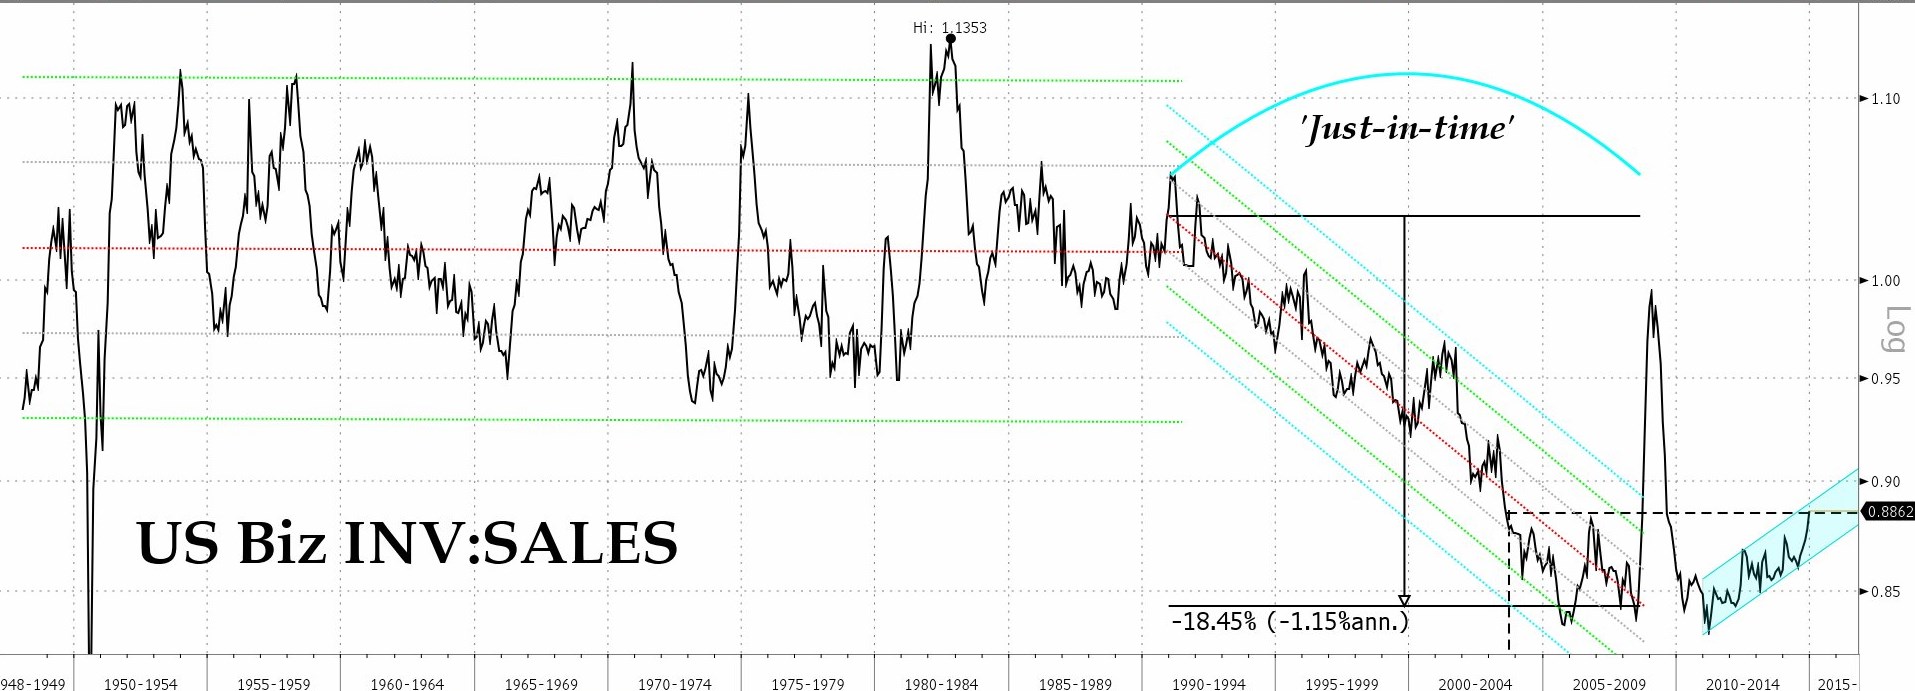
With that in mind, let us note three broad trends which are at work. Number one, inventory/sales ratios are rising to levels not seen (barring the Snowball Earth episode of the Lehman Crash) in anything up to thirteen years across manufacturing, wholesale, and retail. To what extent this just reflects a lag in marking down inventory values but having instantlyto recognise lower sale sprices, rather than something much more sinister, only time will tell. Nevertheless, the adjustment, when it comes, will have to be reflected in both a capital write down and a temporary reduction in profits in the relevant period, so there is scope for further anguish.
Courtesy: Bloomberg
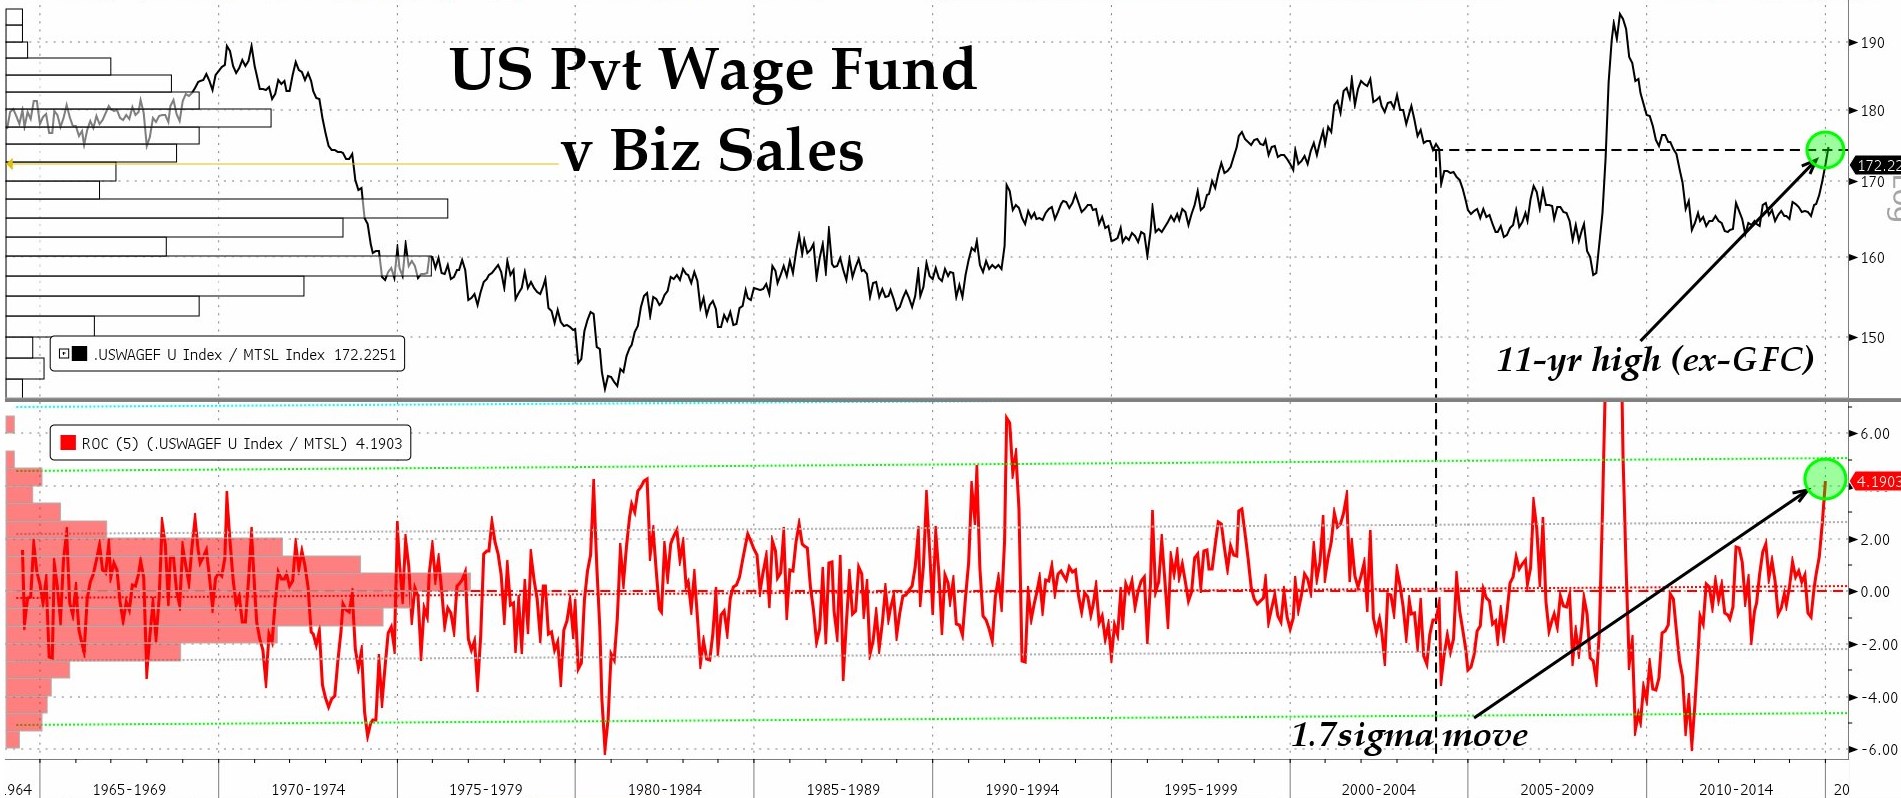
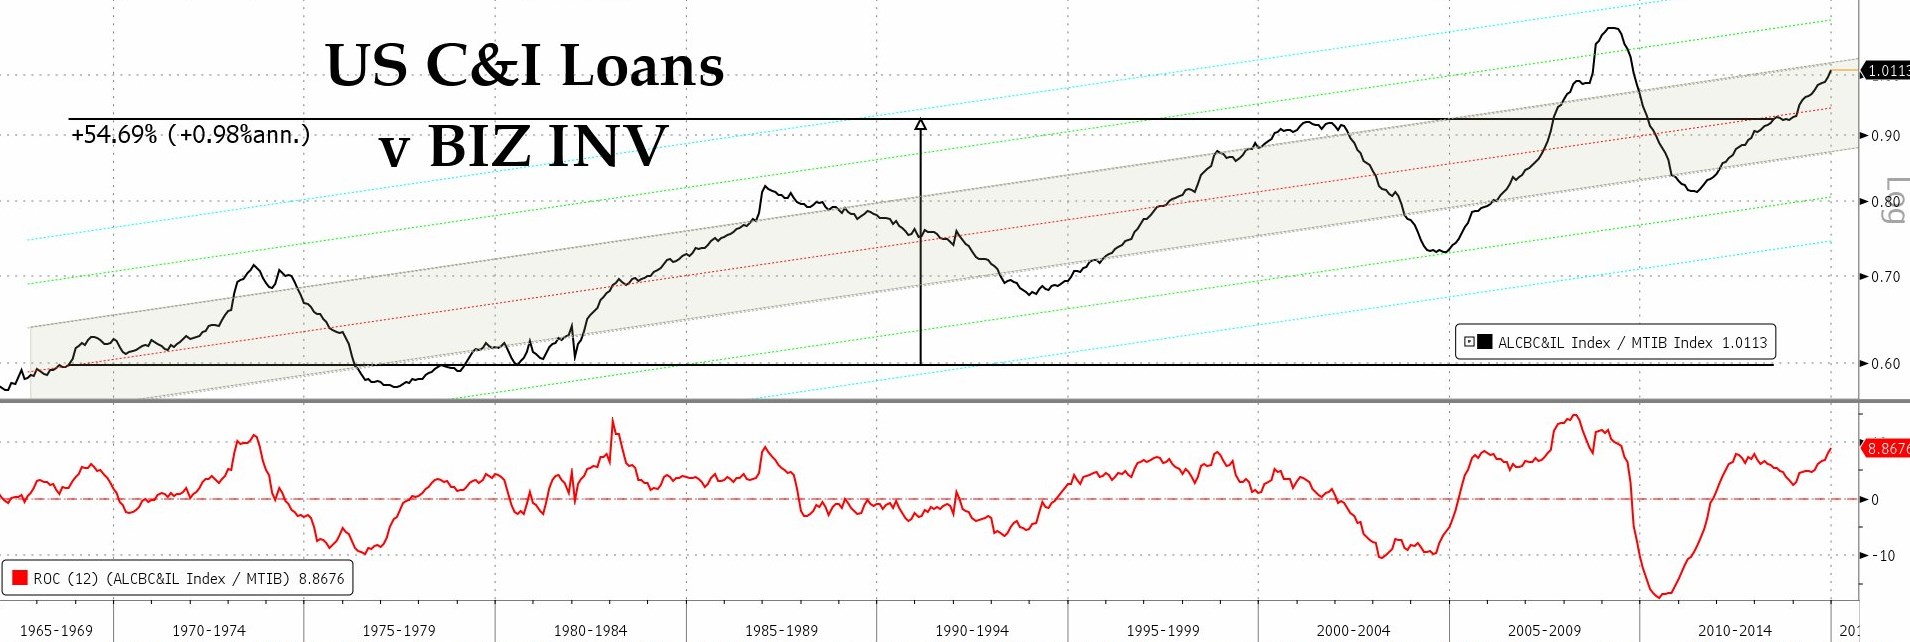
Number two, wage bills in relation to sales receipts have also been pushed to their least favourable in more than a decade and, again, while the marginal return on labour could come out unchanged if the margins are unaltered, lowered revenues could nonetheless serve to jeopardize employment levels. Number three is that the value of outstanding C&I loans is rising in relation to the stock it is financing i.e., collateral coverage is slipping to an extent which may soon start causing jitters among the lenders.
Courtesy: Bloomberg
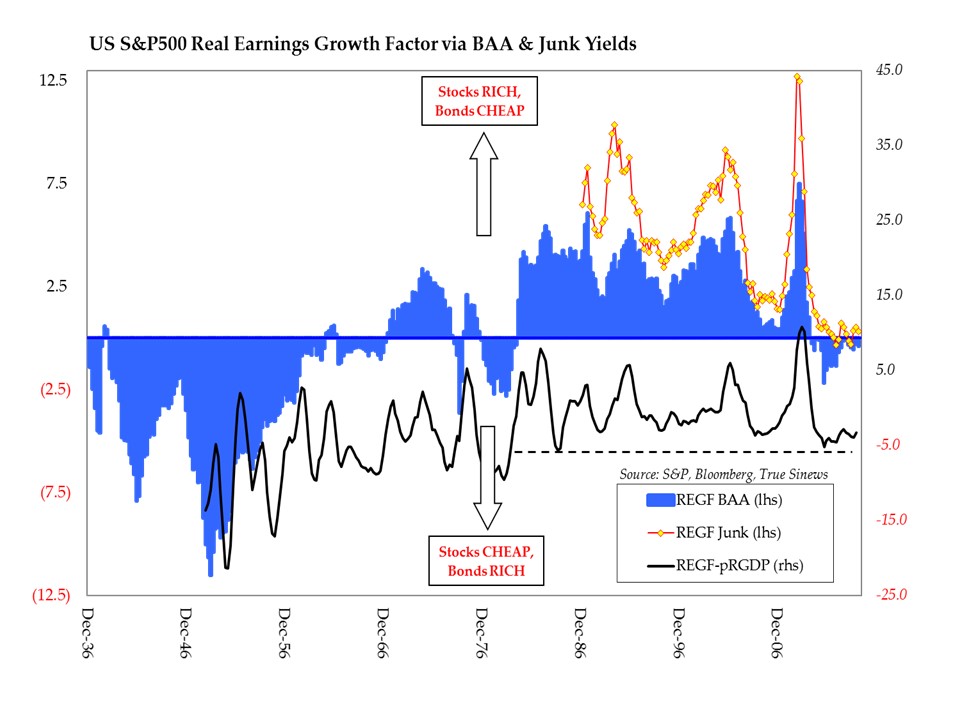
While bearing this wobble in mind, also consider that P/Es are back to where they were on the eve of the last crash as is price/book. Price/sales is where it was at the height of the Tech Bubble and returns on capital – measured using both cash flow and free cash flow – are at or approaching their lowest in five years. As ever, the main source of support for the stock market is the deliberately suppressed level of bond yields.
One way of illustrating this distortion of the bond market is to look at bond risk – such as modified duration – versus bond return, i.e., yield-to-worst. Off the scale, is the simplest way to describe it.
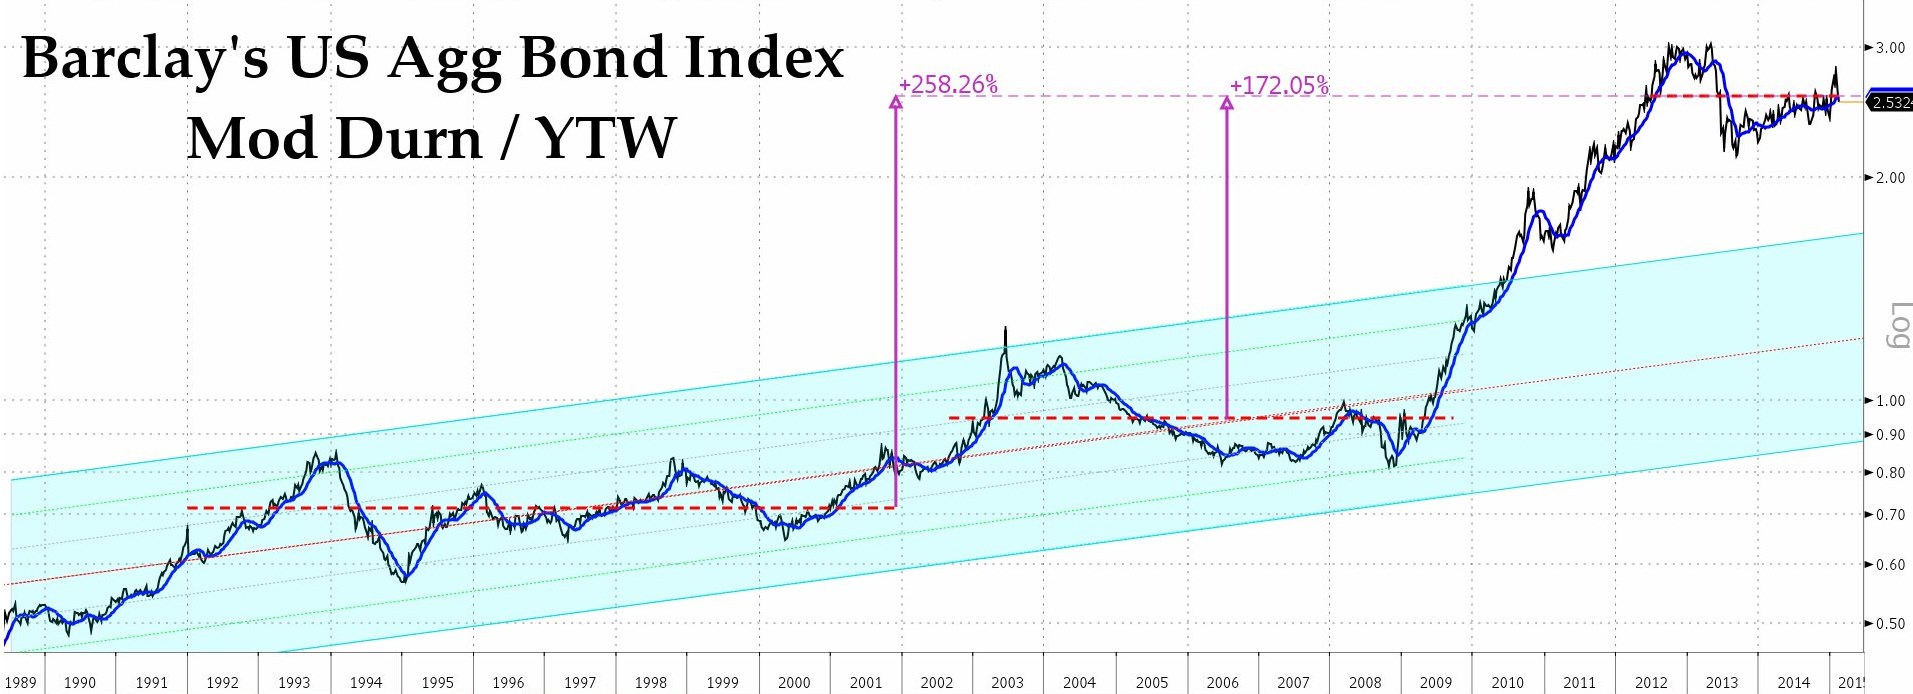
Courtesy: Bloomberg
As unsustainable as all this looks – not to mention how perilous it all is – the key is to try to find a reversal clear enough to be played. A week or two back, we suggested that the T-bond might be headed to 2.20% and that, if such a level held, one should try to sell against it, scaling in above 2.45/50%. Well, 2.22% has been the low so far and we have had a smart 43bp, 8.3% price reversal since hitting it. So far, so good, so short.
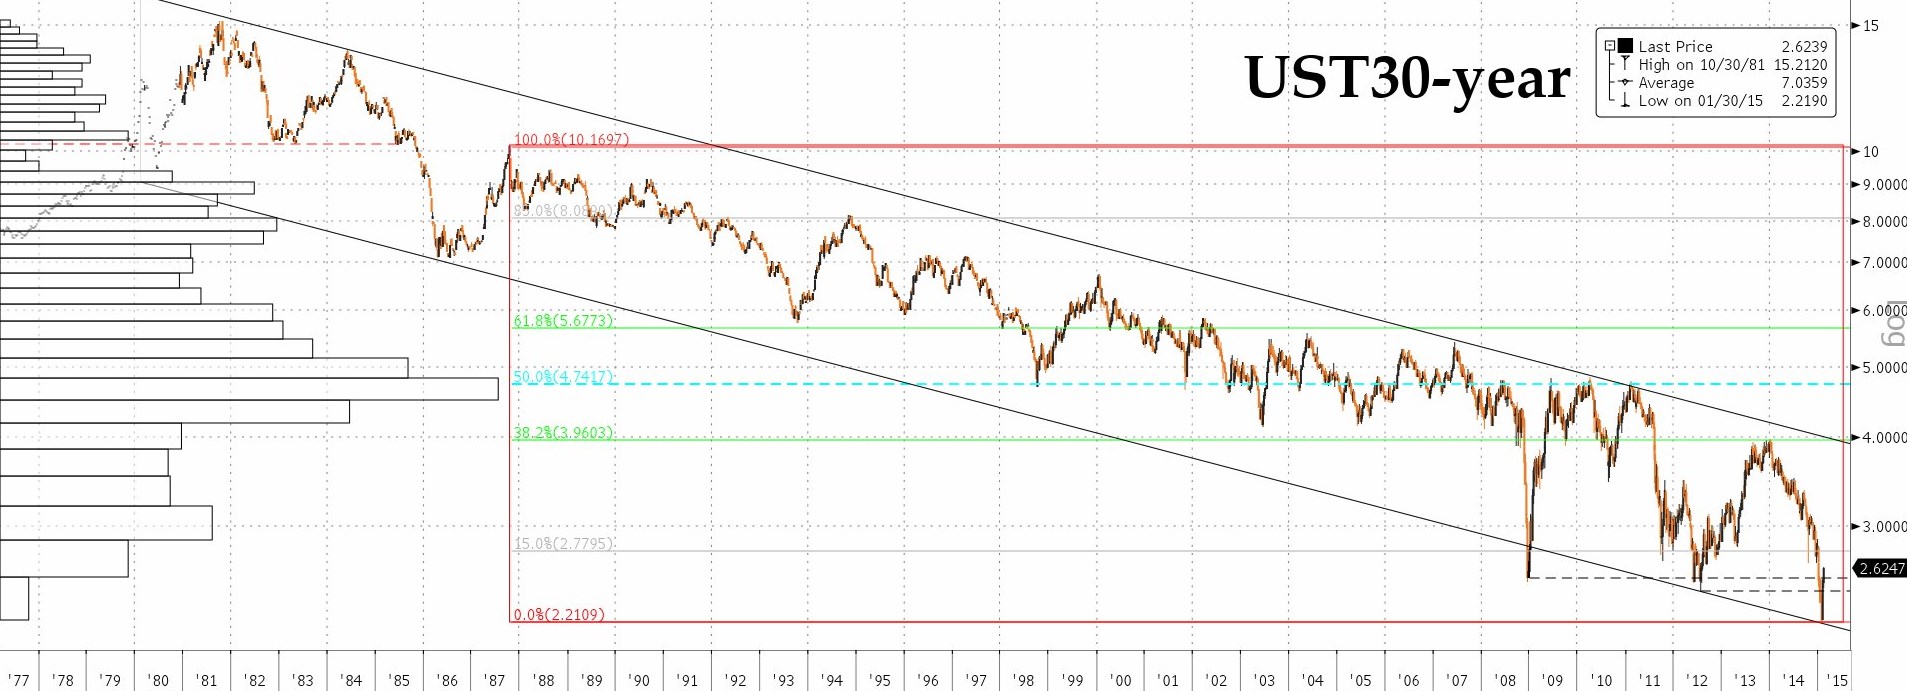
Courtesy: Bloomberg
As for the rest of the market, WTI is testing the top of a neat profile built at the bottom of the rout (and so, theoretically signalling much lower lows ahead). If it breaks the top of this band, it could swing up to a nice, round $60/bbl where the mid-point of the Thanksgiving Day massacre comes in. Brent looks a touch more positive, so signals are mixed and while not yet convinced we have seen the worst, we would hesitate just yet to position too aggressively as a result of the disparity.
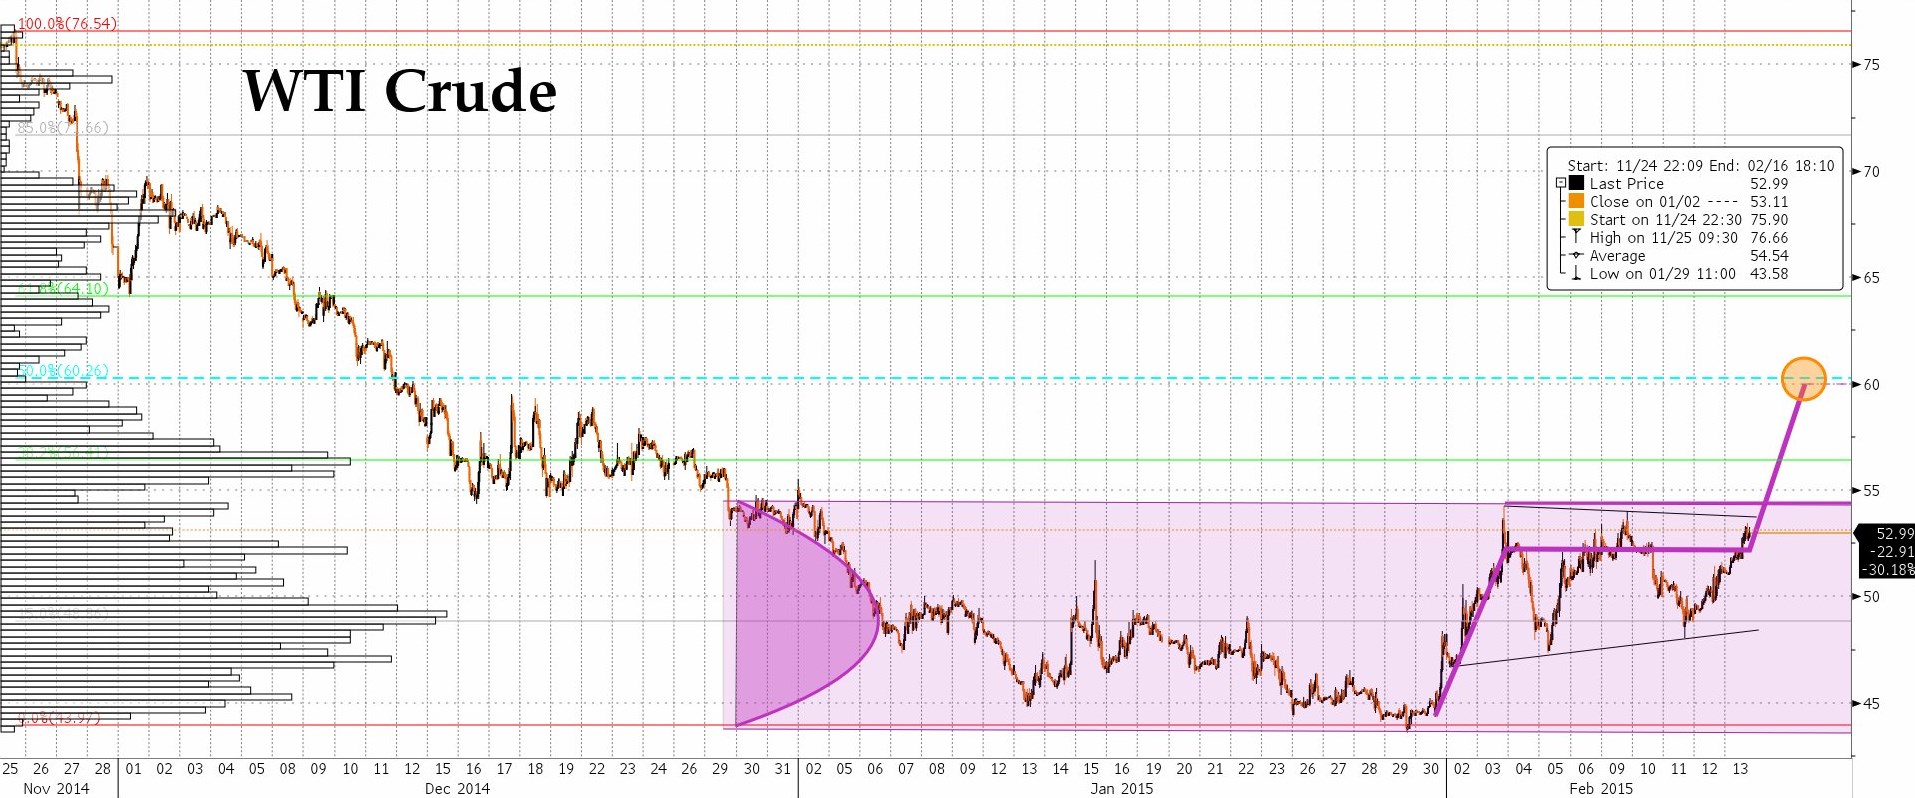
Courtesy: Bloomberg
Copper, too has seen a little cautious buying, taking it back to the bottom of the old range. On the one hand we have maximum spec shorts both outright and as a percentage of O/I: on the other, the recent, hefty cash premium has almost disappeared as LME inventories have built rapidly, rising 85% since Christmas to a 16-month high. Sell any identifiable failure here but stop out if it does build back above $6000
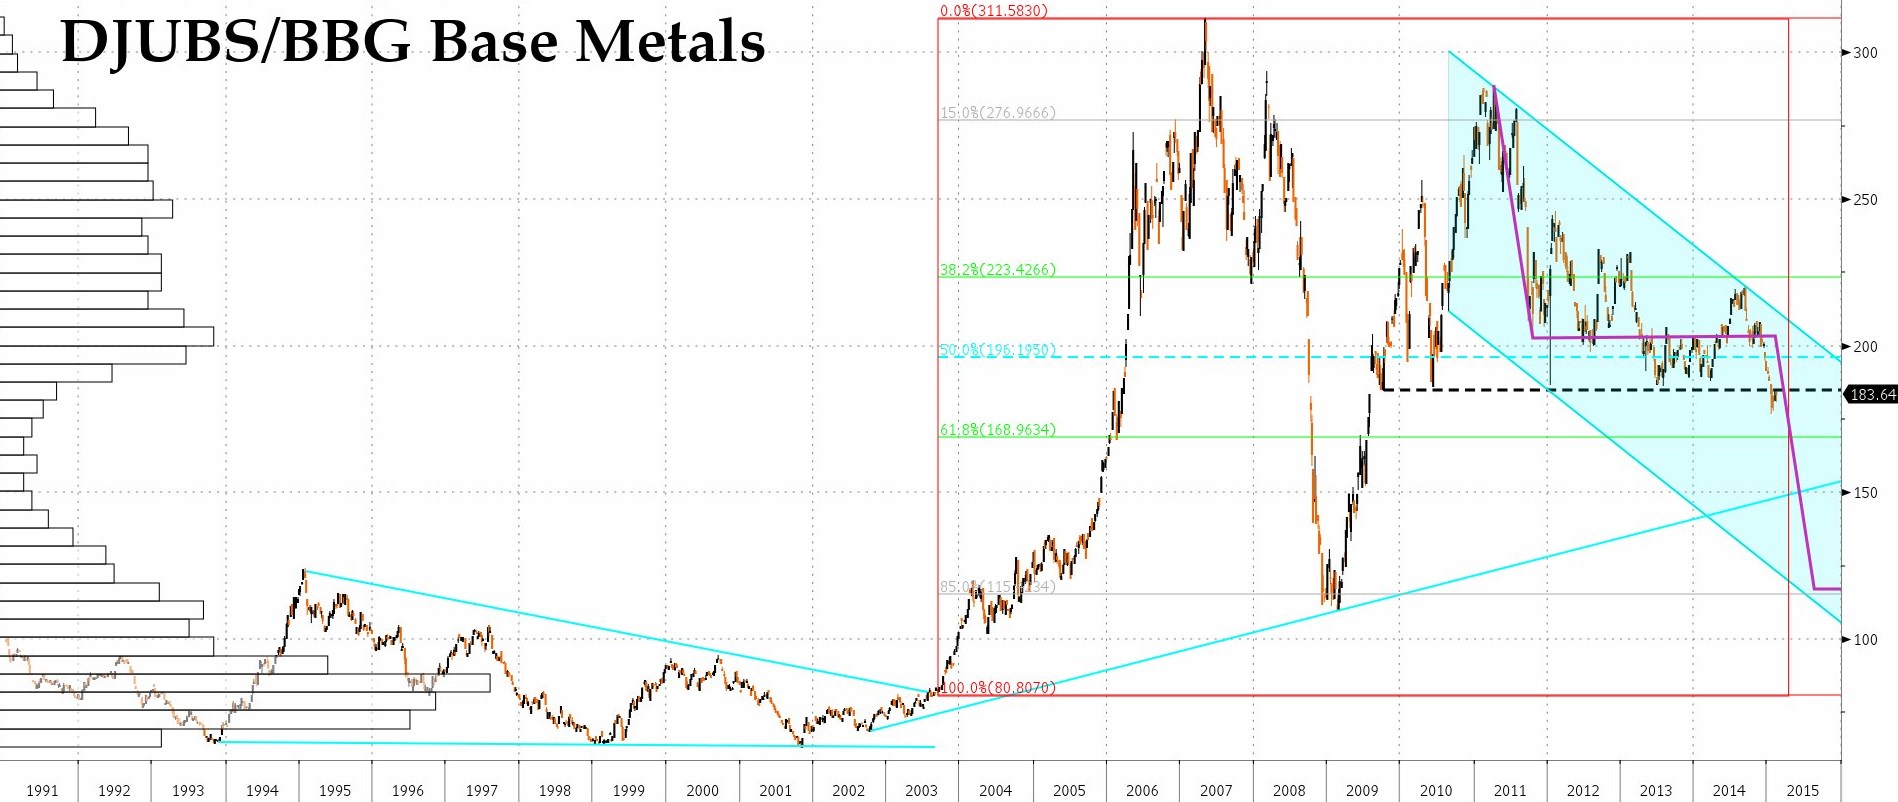
Courtesy: Bloomberg
Likewise, gold – while below $1245/50 – stays negative, looking for a possible retest of $1180 and, one day, a break of the decade-old uptrend to usher in the opening up of a route back to the LEH crisis levels down around $800/oz.
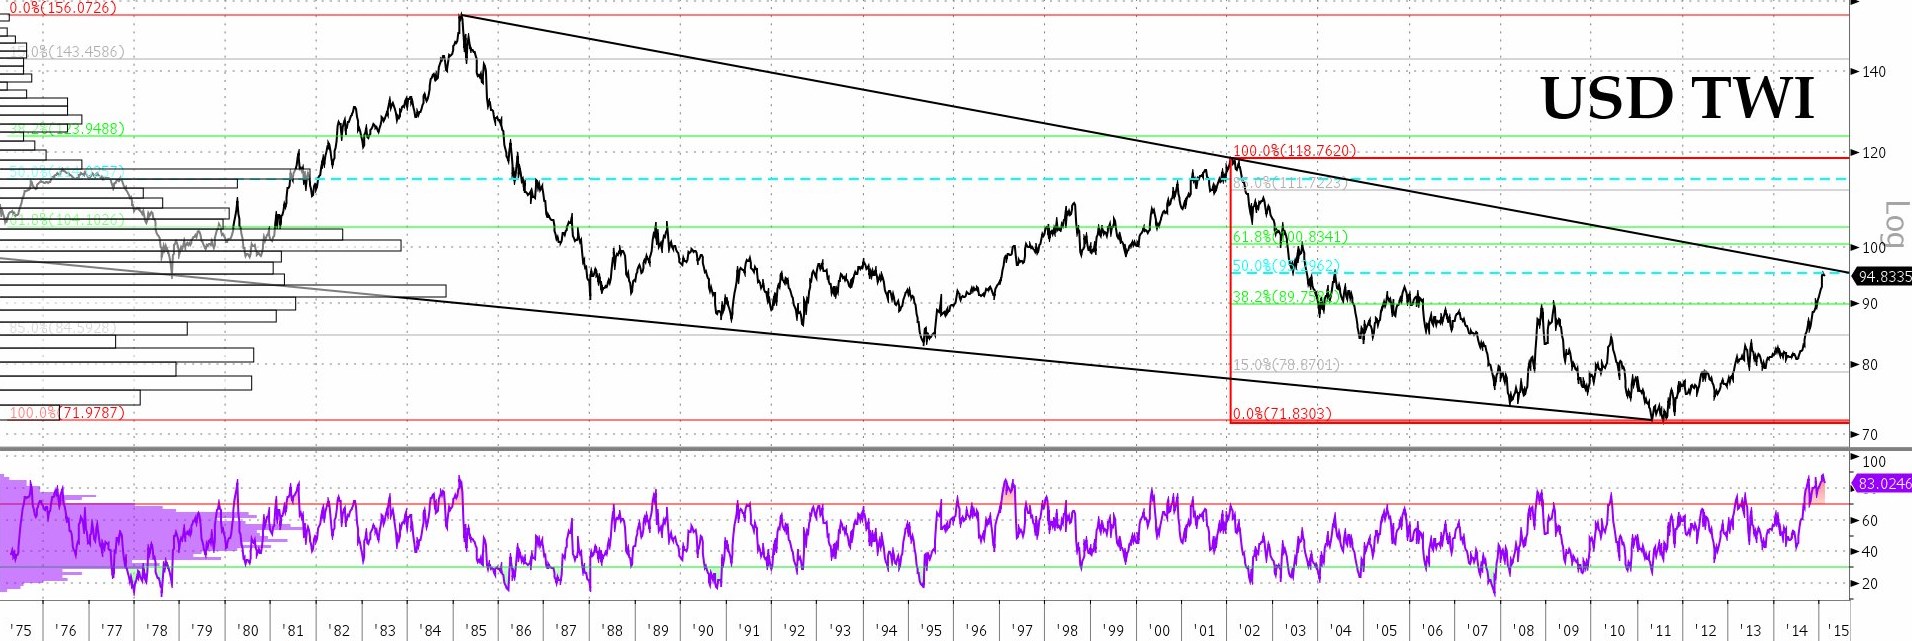
If gold is to weaken further, that almost presumes that risk will not spike higher and also that dollar strength will continue at what is now an important technical level for the greenback – at the 50% retracement of the 2002-11 decline and at fairly overbought levels.
Courtesy: Bloomberg
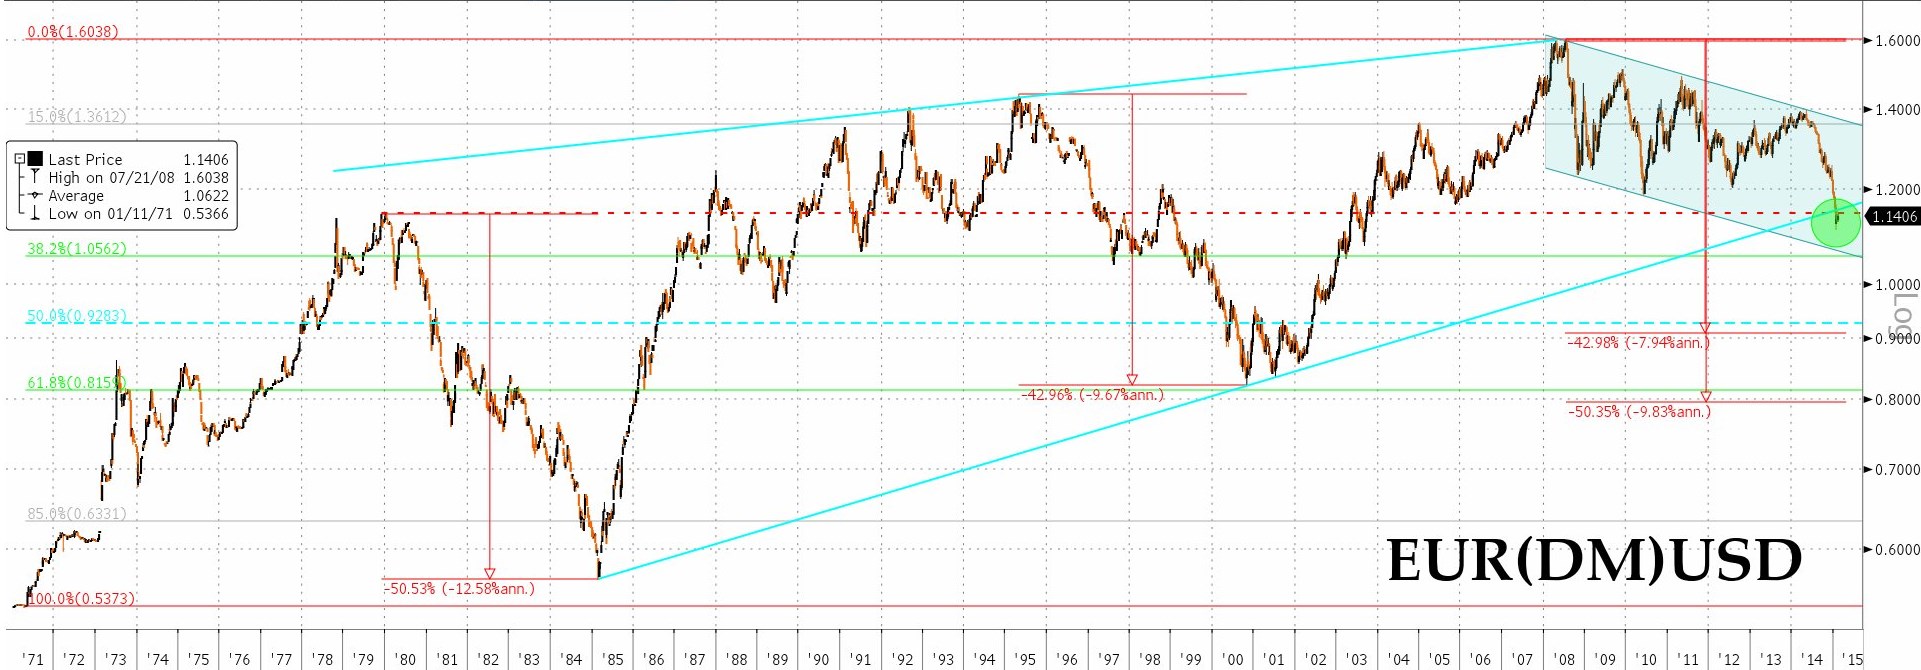
While below $1.450/00 the euro does not look like spoiling the party but rather giving it a boost by falling to the long-term linear mid at $1.0700 (and possibly, since the trend on this chart has already given way to the log one at $9275/00)
Courtesy: Bloomberg
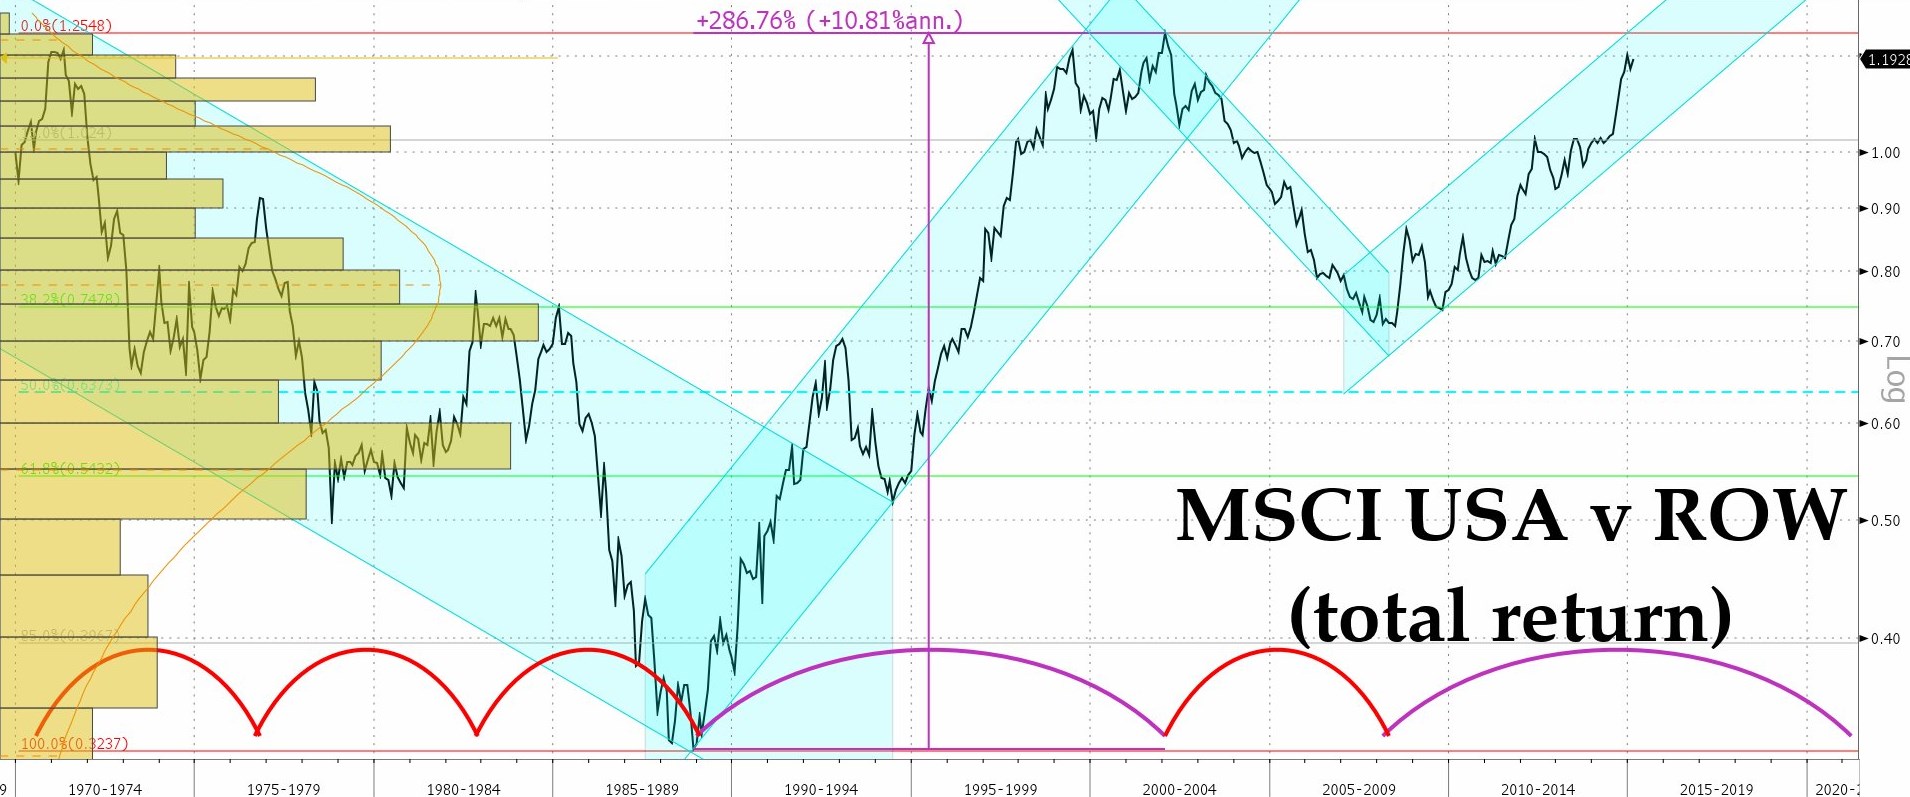
However it is espressed in the weakness of pair currencies, a continued USD advance should mean positive feedback with other US asset classes so it is worth noting that the MSCI US index is fast approaching its historic peak relative to the ROW equivalent. Bears will hope that top holds: bulls will be wishing for a full, swing pattern repeat of the 1988-2002 move and hence for much more upside to come.
Courtesy: Bloomberg
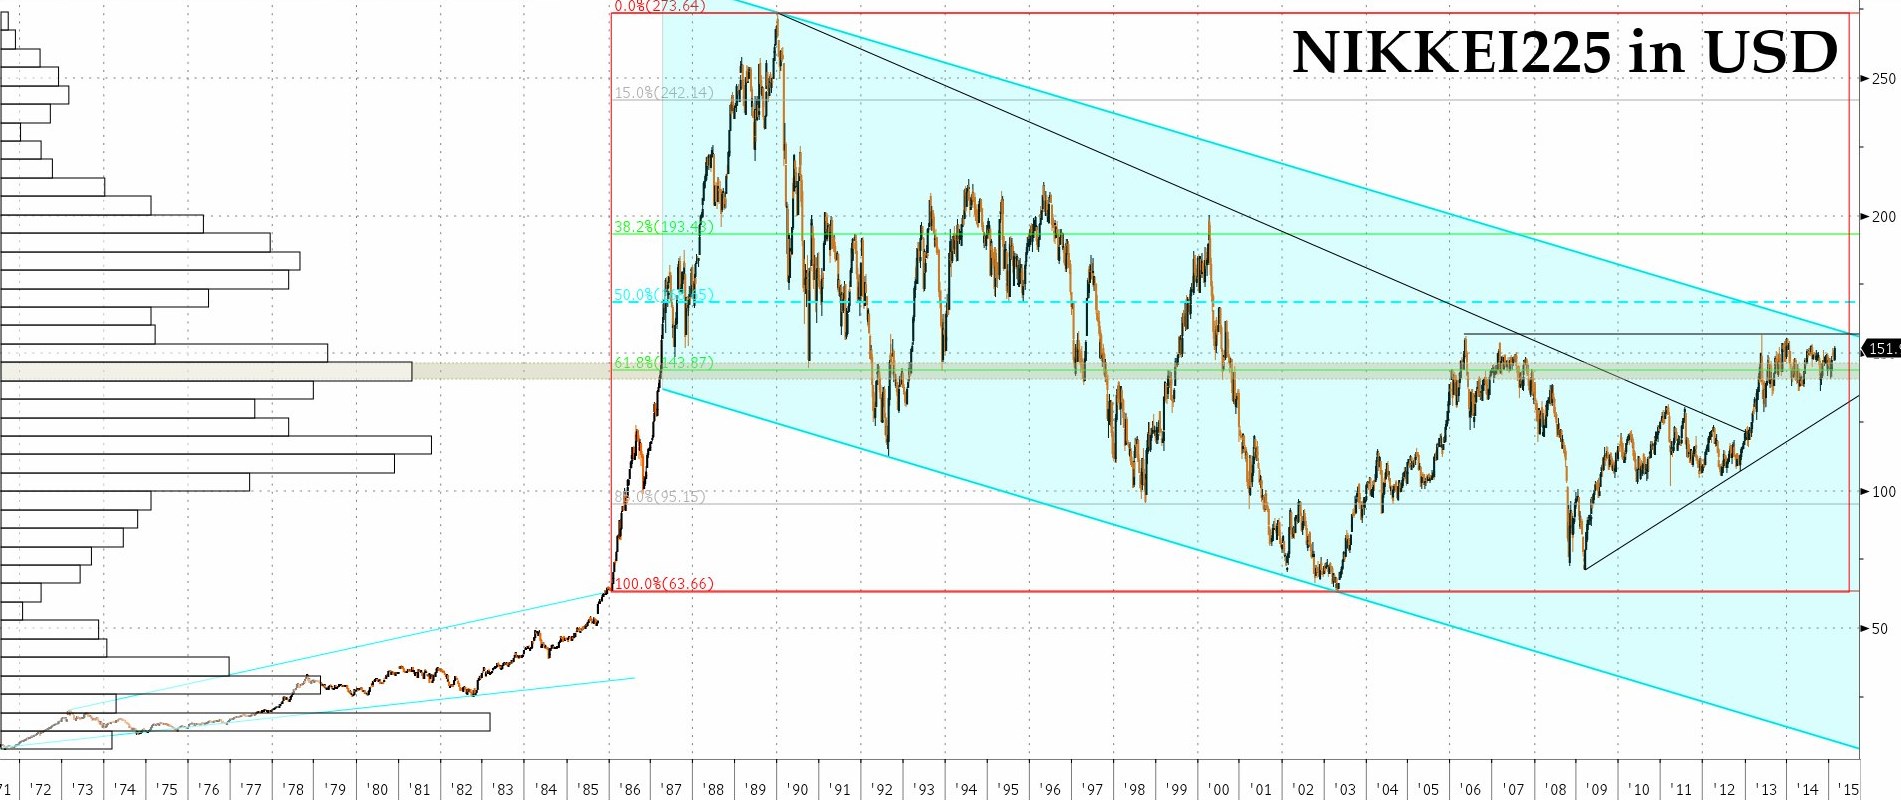
The Nikkei, meanwhile, remains locked – once we peel back the veil of weak Yen money illusion – in the range which has contained it these last 18 months or so. the best hope is that this consolidation wil eventually move the longest line higher both on the medium term scale of the last 5 years of rebound and on the larger scale of the whole three decades of bubble-and-bust.
Courtesy: Bloomberg
The sad fact remains that, if we adjust for changes in the yen’s international worth via the TWI, returns for the entirety of that period sweep out a quasi-normal, mean reverting distribution. Still, a push to the top of that formation’ s value area would be nothing to sniff at, were it to come about through the processes just discussed.
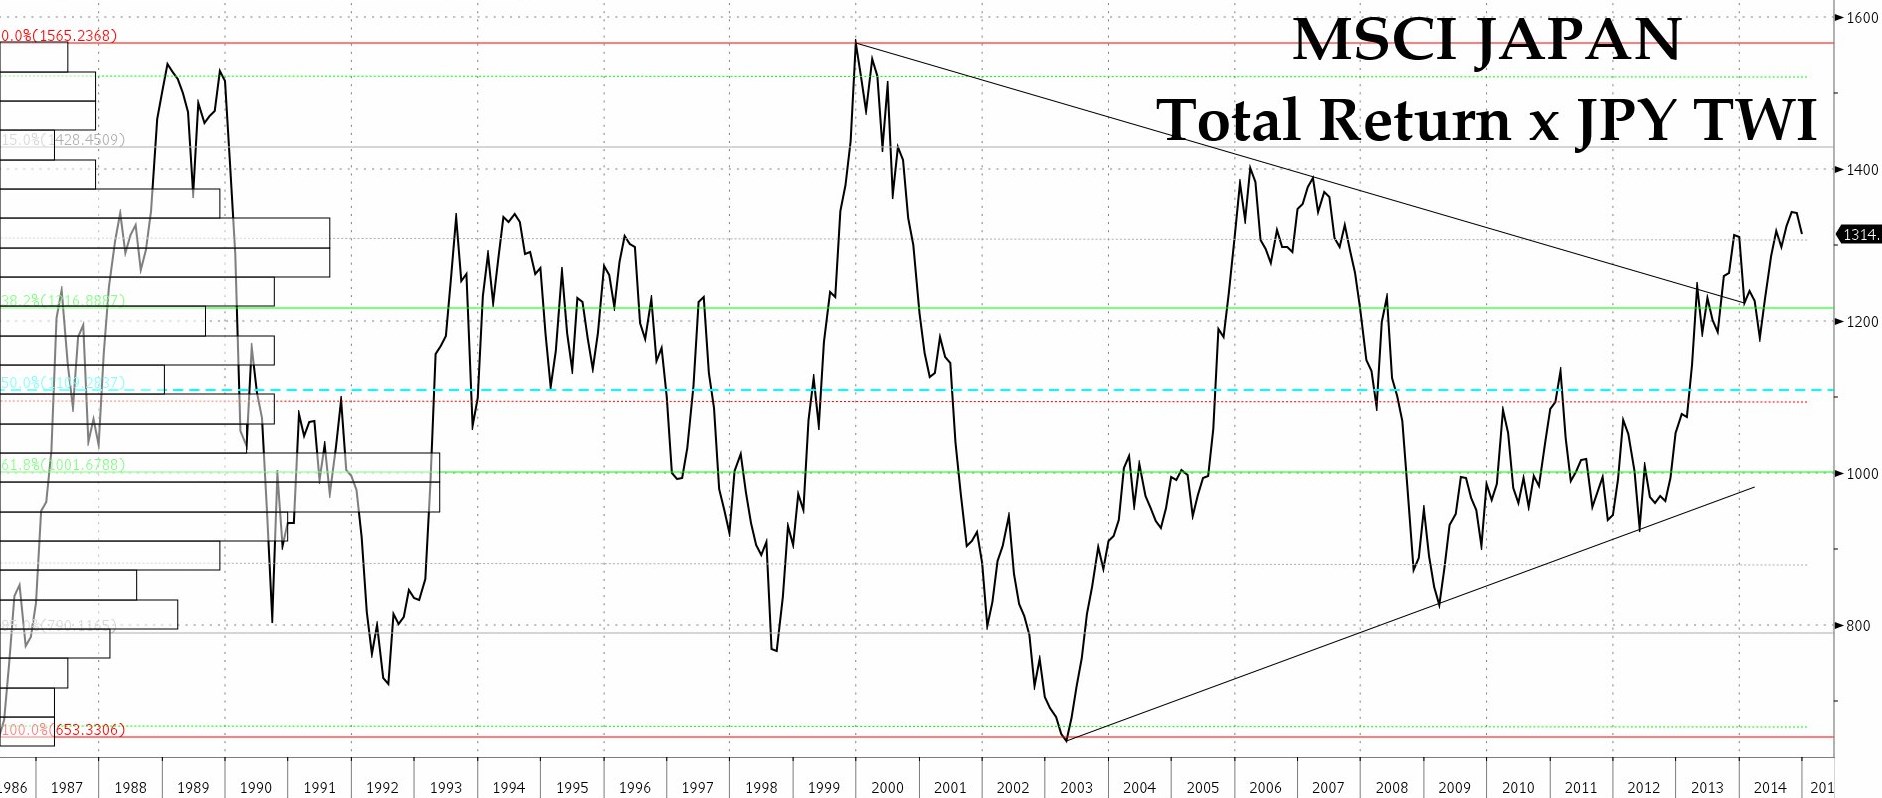
Courtesy: Bloomberg
Finally to Europe, where NIRP is beginning to preclude even momentum-driven returns on bonds and is pushing people instead into the stock market. The DAX appears to have broken out against the REX as a result, meaning it has every chance to test the last cyclical highs, set back in 2007, in the weeks ahead.
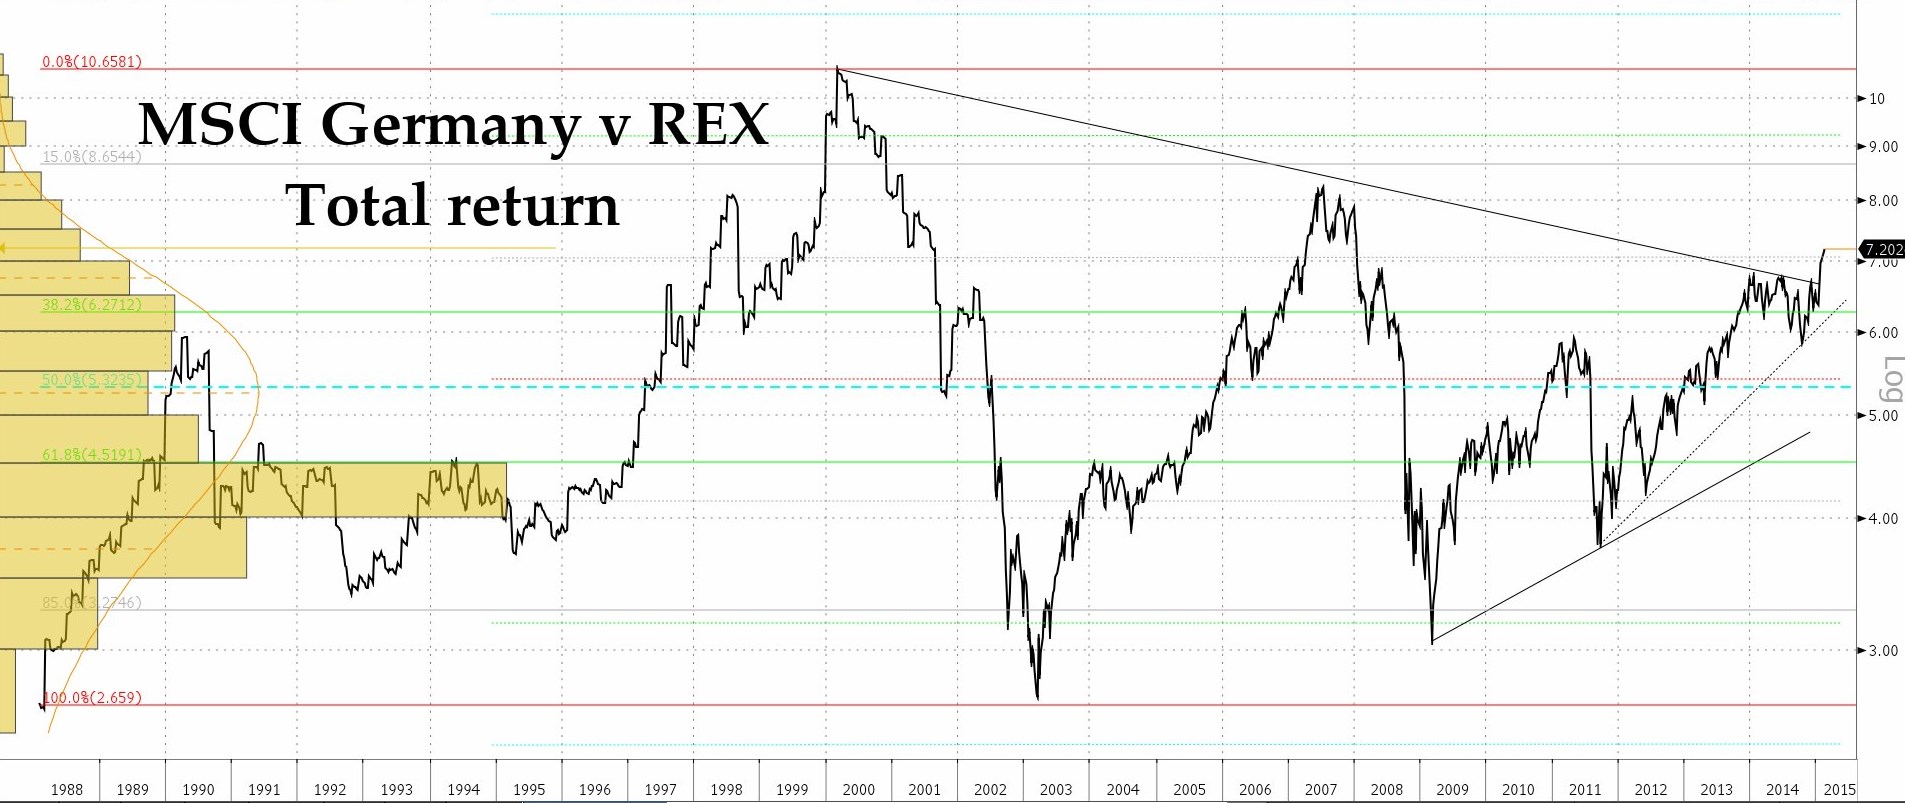
Courtesy: Bloomberg
Note, however, that though the idea of European outperformance is becoming more widely shared – not least because of effects of the rapid growth in money supply even pre-QEuro – there is actually little in the graph of Germany v the USA in common currency to suggest this presentiment will be borne out in practice. If you do wish to play for a rise on the Continent, therefore, it seems as though you would be best advised to hedge up your forex exposure when you do so.
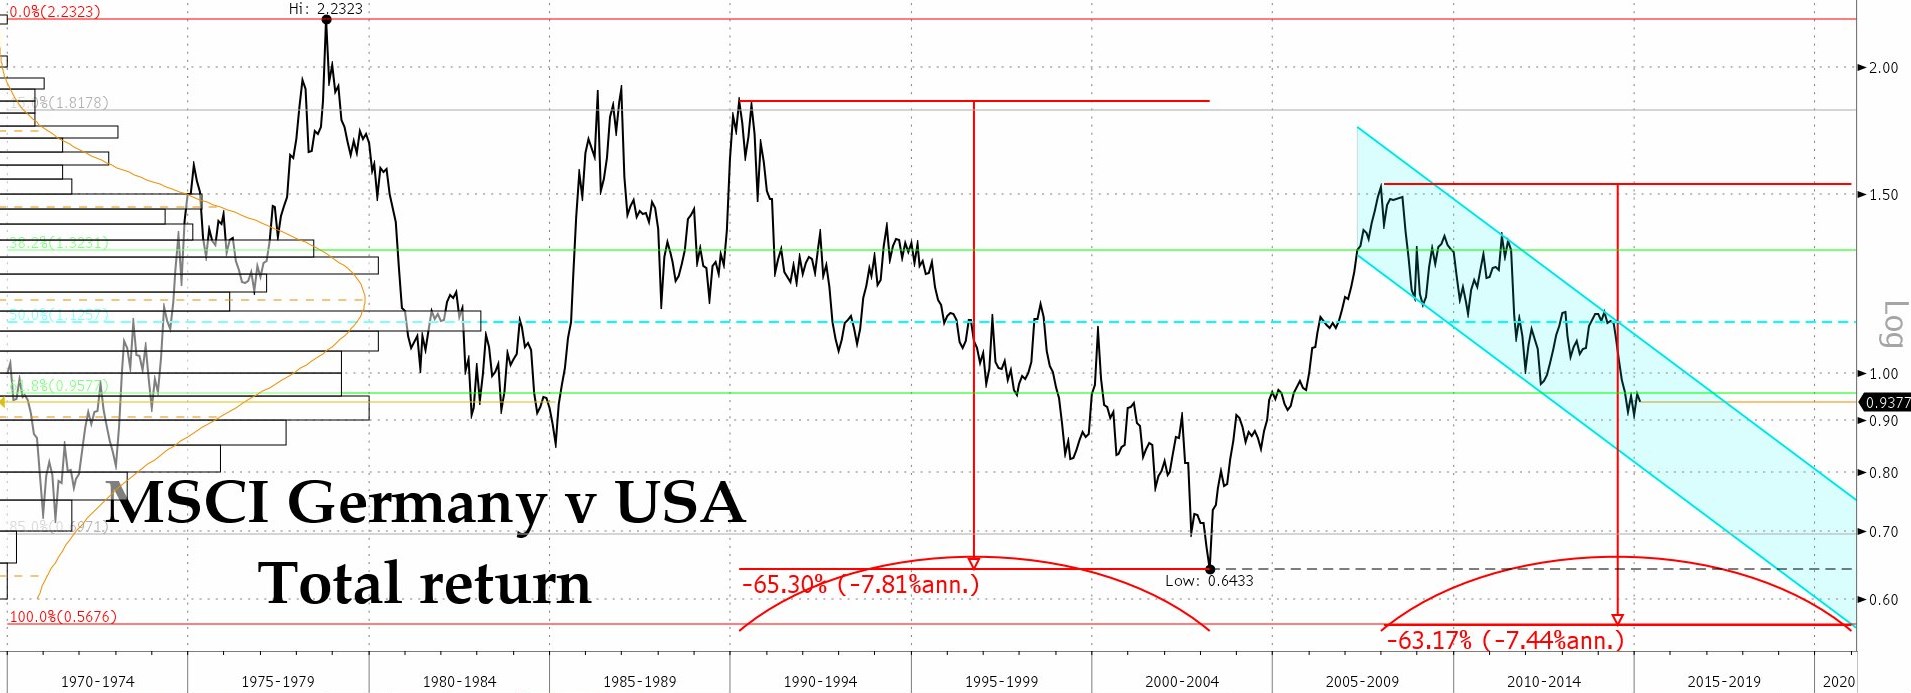
Courtesy: Bloomberg
Good hunting!
NB The foregoing is for educative and entertainment purposes only. Nothing herein should be construed as constituting investment advice.