
Dear Lord, Y’all give us another oil boom…
If there is one sector of the US economy where an Austrian-style Boom-and-Bust bust has taken place, it is the onshore oil industry – though, by extension, other primary resource industries, such as metals and mining and farming have also suffered in the ongoing aftermath of the general commodity bust.
The good news is that the Austrian prescription for how to deal with a such a calamity has also been followed. The weak have ceded control to the strong – whether by bankruptcy, equity dilution, or co-option and takeover. Prices have been allowed to fall; payrolls – alas, for the unfortunate souls involved – have been cut; the more marginal projects have been put in abeyance, while an unrelenting search for greater efficiency has gone so as to reduce the level of the all-important cut-off between profit and loss.
As a result – and even if we do have to offer a caveat that much of what is afoot is also taking place under the baleful influence of over-easy monetary conditions – the industry has not only found a base, but has even begun to expand once more with no bail-outs, TARPs, or other assistance from a government apparatus (which, if anything has been intensely antagonistic to the industry on ideological grounds), saving only the putative enactment of last autumn’s OPEC agreement to limit output elsewhere.
To put this into context, we could perhaps start with a Moody’s report from the middle of last year which summed matters up by declaring that the oil bust was fully comparable with that vast destruction of value which took place during the first great Tech-Telecom mania at the turn of the century.
Admittedly aggravated by the subsequent global upheaval which the 9-11 attacks occasioned, that latter episode, it should be remembered, ushered in a full-blown recession and inveigled the Fed, the fledgling ECB, and the ever-pliant BOE into cutting rates too far, too fast, and for too long with what was then explicitly admitted to be the intention of encouraging household and government borrowing as an offset to the ongoing corporate retrenchment.
We all know where that led!
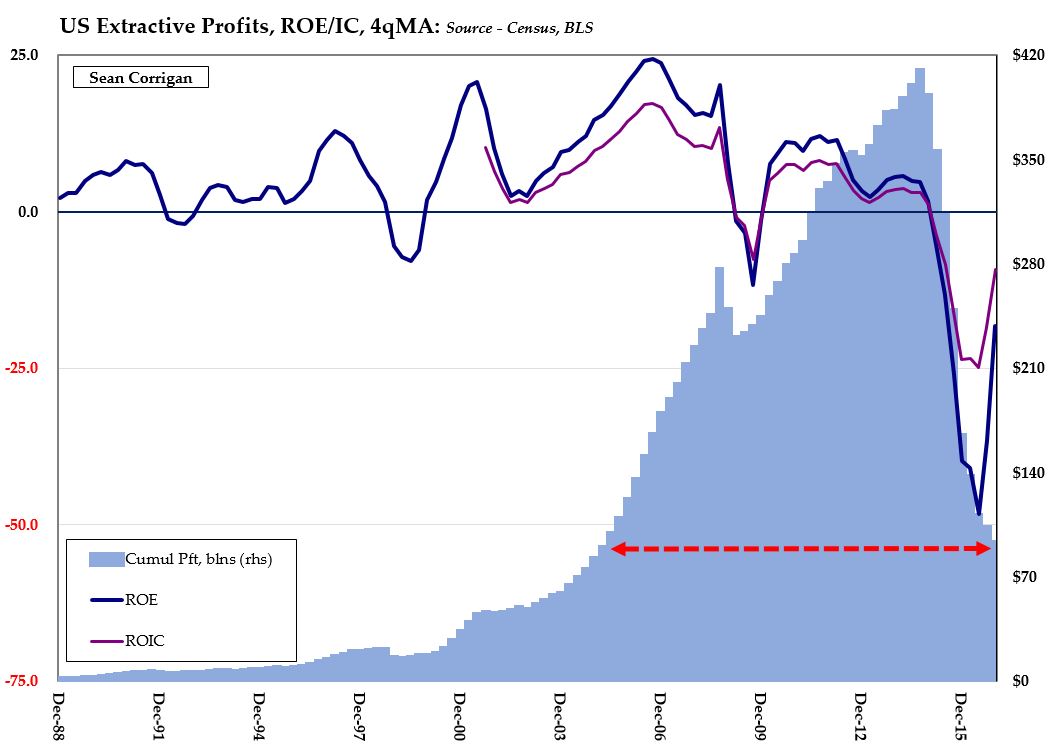
Consider that, in the three years 2012-2014, the 110 global energy companies (70% of them US-owned) routinely monitored by the EIA spent something like $350 billion more on capex and shareholder pay-outs than they accumulated in operating cash flow. Though only around a third of them were free cash flow positive in this stretch, six out of every seven of them managed to report a profit. Cash flow itself peaked at just over $160 billion in the fateful third quarter of 2014 before plunging ever downward, dropping almost 75% to its nadir in the first trimester of last year.
Meanwhile, capex – having peaked a little earlier in 2014’s third quarter at over $170 billion – shrank by something of the order of two-thirds over the succeeding two years, to touch $56 billion at the last count.
Along the way, at its worst, fewer than one in five companies now had any positive free cash flow; fewer than one in six were able to conjure up an accounting profit. Meanwhile, in the first fifteen months of the bust, cumulative impairments of approaching $300 billion were acknowledged, neatly consigning the prior three years’ capital infusions to the Memory Hole.
Almost a decade’s worth of gains flared off – POOF!
The effect on credit markets was substantial. That various ratings agencies reported that up to one-third of the speculative grade issues to which they had given their imprimatur were in default by the mid-point of last year, with Fitch noting that fully 84% of all US defaults for the year were commodity-related. Compounding this carnage, Moody’s had earlier calculated that recovery rates on defaulted energy bonds – which had averaged 58.6% over much of the previous three decades – had slumped to an appalling 21% in 2015.
A similar picture emerges from the ‘Shared National Credit’ survey conducted jointly by the Fed, the FDIC, and the OCC. Though only covering the first few months of last year when energy prices were at their lows and so before distress levels had reached the summer’s dreadful climax, this shows that while only accounting for approximately one-fifth of newly syndicated loans over the previous two years, a sum equivalent to close to half of this total became classified as ‘substandard, doubtful, or in loss’ in that time, a figure which was more than three times the sum for all other industries combined.
Thomson Reuters’ tally for all this is that distressed debt restructurings in the US soared by a factor of 4 ½ in 2016, against an ROW increase of 40%. Of the global increase, no less than two-thirds were due to US resource companies, six out of seven from the energy and power sector, the remainder coming under the rubric of ‘materials’. Using bankruptcy filings to reckon a total, big Texas law firm Haynes & Boone, independently came up with a figure of 119 E&P firms, 118 oil service outlets, and a further 19 ‘midstream’ entities having gone to the wall since the start of 2015 (25 of them established on the Canadian side of the 49th parallel), collectively taking a combined total of $119 billion in debt down the gurgler with them.
At the same time, there was nearly $1.2 trillion of M&A activity taking place in these two categories, three-quarters of that in energy. Elsewhere there were also signs of market dominance, with one-third of all US equity issuance in what was otherwise a lacklustre year being clocked up – the 40% increase in fund raising here contrasting markedly with the 35% drop recorded in all other areas.
Nor has all of this latter activity been simply a side-effect of distress. As oil and gas prices have rallied over the past nine-months and as the incredible improvement in drill-bit efficiencies interact with lowered oil service costs, operating cash flow has staged something of a rebound, having nearly doubled in the six months to September, pushing half our 110 companies back into positive territory as well as to accounting profitability. The ratings agencies are near unanimous in their belief that default rates this year will subside back to a lowly 3% – a tenth of what they were six short months ago.
America’s ‘hidden’ recession
So impressive has the renaissance been, in fact, that the Dallas Fed has even been sounding market participants out on the question of whether they can already see another bubble emerging in the sector. As alternatives research house Preqin pointed out, as much as $45 billion in new private equity capital was raised by devoted North American energy funds last year, taking the spendable total – the so-called ‘dry powder’ – in resource-targeted vehicles to a hefty $173 billion, more than double what it was in 2008.
Not surprising then that the same Dallas Fed survey had the count of E&P respondents seeing an increase in business activity outweighing those experiencing declines by a 5:1 margin – though what was perhaps guaranteed to get the contrarian antenna twitching was the fact that whereas 71.4% of those asked saw oil prices higher in the coming months, a shrinkingly small 1.4% thought they would decline. Likewise for natgas, bulls outscored bears by 50% to 7.5%.
At this point the non-specialist reader might here wish to know what all this implies for a broader view of US economic prospects and why we have so belaboured the oil patch boom and bust, other than for the sheer Austrian delight of it all.
The answer, in a nutshell, is that when we strip out the direct impact of this bust from the numbers (the indirect must of course remain unquantifiable if nevertheless of note), we find that we can explain a good deal of the niggling weakness which has characterized the overall macro picture these past several quarters. After all, the fact that energy plummeted from a record high ~25% share of total industrial production to barely half that in such a short time can hardly have had no further repercussions, can it?
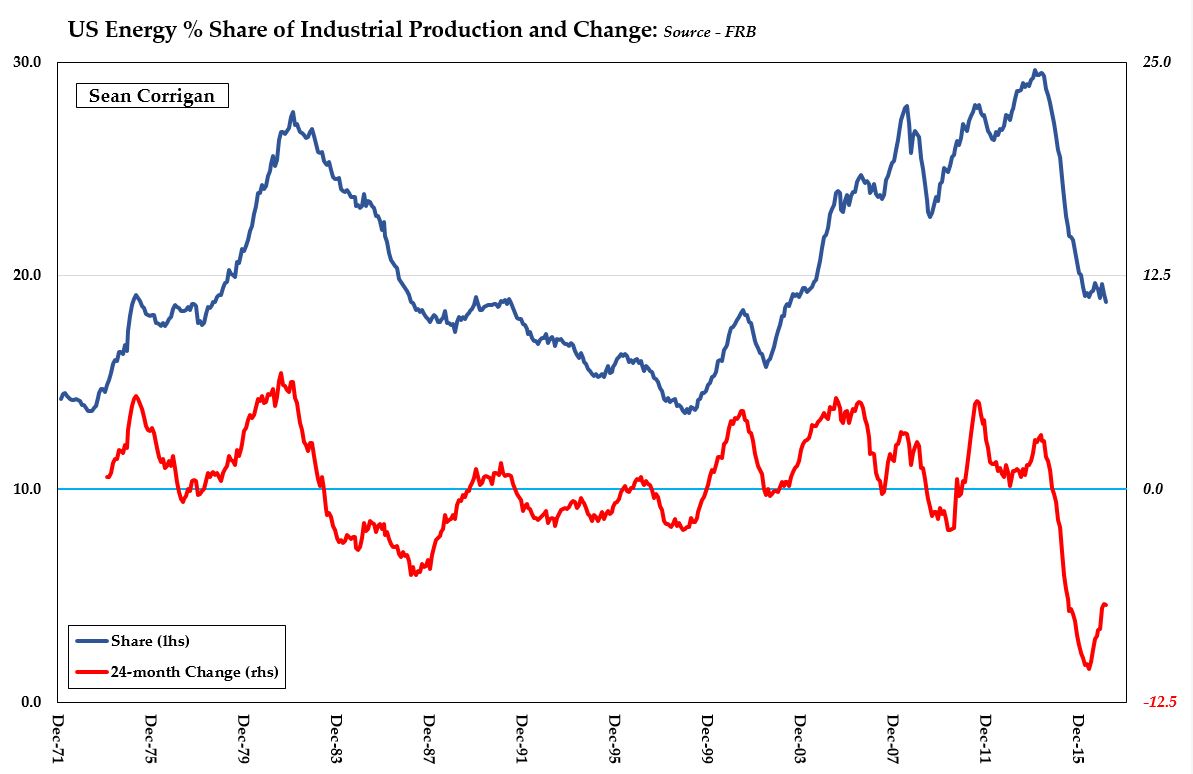
Any surprise IP has been sickly?
To somewhat update a brief comment we recently made on this issue, one area this shows up is in employment where the headcount in the four BLS categories most readily identifiable with the sector – oil & gas extraction, support services, pipeline construction and machinery manufacture – topped out two summers ago at a multi-year high of around 780,000. In the final months of last years, that had sunk to to under 550,000 after a larger arithmetical and proportional loss than in the 2008 bust. Mining and primary metals manufacturing meanwhile have dropped from 610,000 to 550,000 so that the two areas have shed all of 290,000 jobs, talking them – right back in 2002 to where it was in the earliest days of what would come to be called the ‘Supercycle’.
If we note that, over the past two years, the entire goods producing sector added a roughly equal quantum of new jobs – circa 160,000 – the scale of the drag can be seen to be appreciable in its direct effects alone, especially when we note that workers in the sector typically enjoy an hourly wage rate of 25-30% higher than the private sector norm.
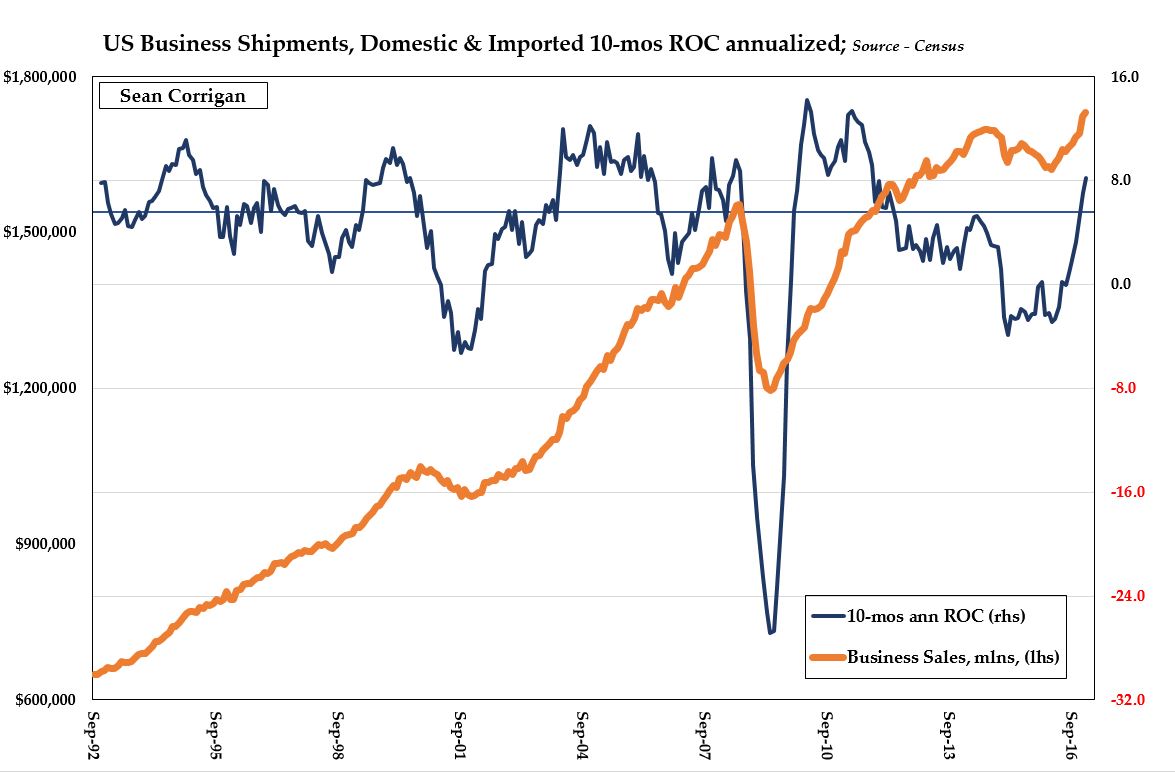
Turning to the effects on their employers, perhaps the easiest way to track this is via the impact it had on shipments (aka, business revenues) of various classifications of goods.
Between the summer of 2014 and the first quarter of last year, monthly durable goods shipments as a whole fell $3.6 billion, thanks largely to a $4.7 billion drop in primary metals sales. Similarly, for non-durable manufactures, the $37.4 billion loss endured was almost entirely attributable to a $34.2 billion drop in petroleum and coal product sales. Wholesale durables were likewise off $5.0 billion and non-durables by $34.3 billion on the back of a $4.6 billion slump in metal & mining products and a hefty, $40.1 billion plunge in petro-coal items. Retail sales, meanwhile, have had to weather a $14.5 billion deficit in the contribution made by gas stations and fuel dealers.
Even in the benighted core capital goods sector, we can find the footprint of the commodity bust. Close to 10% off their best levels of two years ago, the $6.3 billion shortfall there is more than accounted for by a reduction of $1.7 billion in sales of minefield equipment and falls of $3.2 billion each in iron & steel machinery and farm equipment.
The good news, then – especially for those sensitive to the wider, Austrian measures of activity in addition to those which make it through to nominal GDP – is that much of this weakness has since reversed, pushing the annualized gain in manufacturing, trade, private construction, and import turnover to a brisk 8.2% clip over the most recent ten months in the series; not only a new record high, but also the best for a like period in over 5 years and decisively back above the 5.2% CAR for the pre-Crisis stretch 1992-2008.
Now, then, Lord. About that Mercedes Benz….
Sean Corrigan